Availability - what the rivers will give up
Generated by build_scheme_availability.py. First chapter of the scheme layer: the resource, before anything is built to catch it.
Generated by build_scheme_availability.py. First chapter of the scheme layer: the resource, before anything is built to catch it.
papers/scheme/README.md fixes the order - availability, then aquifer, then the reservoir as a residual - because a reservoir is a buffer rather than a purpose, and sizing it first means picking a number and then building a scheme to justify it. This chapter is the first of those three.
The headline, and it is not a good one
Across the nine inflow gauges, the mean divertible resource is 148 Mm3 per water year. In the drought year it is 31 Mm3 - 21% of the mean.
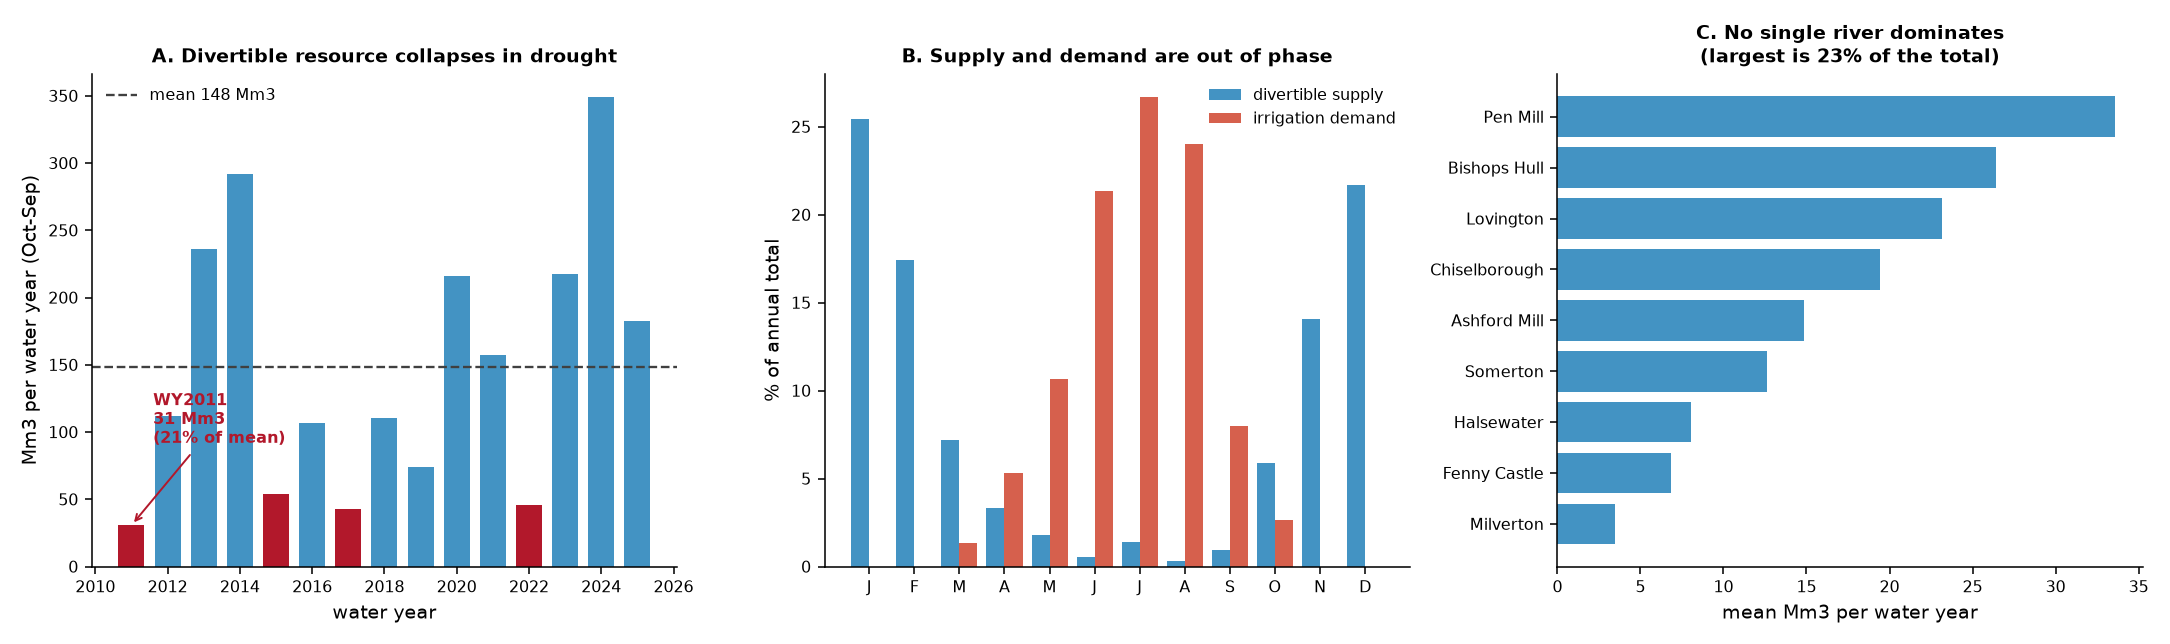
The resource disappears in exactly the years the scheme exists to cover. That is not a surprise on reflection - the trigger is a high-flow threshold and a drought is the absence of high flows - but it settles the scheme’s operating principle before any design work starts:
A drought scheme in this catchment cannot be supplied during a drought. Everything it delivers in a dry year must have been banked in a wet one. The scheme is a carry-over store, not a run-of-river transfer, and its binding specification is how long it can hold water rather than how fast it can collect it.
That single sentence is what the aquifer chapter then has to test, because carry-over is precisely what the capacitor is for and precisely what leakage takes away.
Water years, worst first
| water year | divertible Mm3 | % of mean | |
|---|---|---|---|
| 2011 | 31 | 21% | drought |
| 2017 | 43 | 29% | drought |
| 2022 | 46 | 31% | drought |
| 2015 | 54 | 36% | drought |
| 2019 | 74 | 50% | |
| 2016 | 107 | 72% | |
| 2018 | 110 | 74% | |
| 2012 | 112 | 75% | |
| 2021 | 157 | 106% | |
| 2025 | 183 | 123% | |
| 2020 | 216 | 145% | |
| 2023 | 217 | 146% | |
| 2013 | 236 | 159% | |
| 2014 | 292 | 197% | |
| 2024 | 349 | 235% |
4 of 15 water years deliver under half the mean. They are not evenly spread: 2011, 2017, 2022, 2015. A scheme sized on the mean is sized on a year that happens about half the time.
The record opens on the worst of them
WY2011 runs 1 October 2010 to 30 September 2011, and it is the first complete water year in the record. A model started with empty stores on 2010-01-01 therefore gets no fill season at all before the worst drought in seventeen years. Any performance figure taken from a cold-started run is measuring that accident and not the scheme; the drought-test chapter deals with it by spinning the stores up to a mature state first, and reports the cold-start penalty separately because how long a new scheme takes to become useful is itself a result.
The seasonal mismatch
86% of the divertible volume arrives in November-March. 72% of irrigation demand falls in June-August, when only 2% of the resource is there.
This is the seasonal battery framing, and it is worth stating precisely because it decides what counts as a loss. The scheme’s product is not water - the catchment has plenty in February. Its product is water in July. Any loss mechanism that returns water to the river in winter costs the scheme almost everything while costing the catchment nearly nothing.
The aquifer layer adds the awkward half of this: the water table peaks in January-February, so the ground is at its fullest exactly when the surplus arrives. Availability and acceptance peak together, which is convenient for volume and hostile to headroom.
Where the resource is
| gauge | river | mean Mm3/yr | Q12.5 trigger m3/s | Q19 hands-off m3/s |
|---|---|---|---|---|
| Pen Mill | River Yeo / Somerset Yeo | 33.6 | 5.73 | 3.83 |
| Bishops Hull | River Tone | 26.4 | 6.62 | 4.87 |
| Lovington | River Brue | 23.2 | 4.78 | 3.12 |
| Chiselborough | River Parrett | 19.4 | 3.64 | 1.85 |
| Ashford Mill | River Isle | 14.9 | 2.91 | 1.98 |
| Somerton | River Cary | 12.6 | 1.95 | 1.21 |
| Halsewater | Halsewater / Halse Water | 8.0 | 2.39 | 1.82 |
| Fenny Castle | River Sheppey | 6.8 | 2.24 | 1.79 |
| Milverton | Hillfarrance Brook | 3.5 | 1.07 | 0.80 |
No single river dominates. The largest, Pen Mill on the River Yeo / Somerset Yeo, carries 23% of the total; the top two together carry 40%, and it takes 6 gauges to reach 80%.
That is an awkward result rather than a reassuring one. A distributed resource means a single intake commands only about a fifth of it, so the scheme either accepts a much smaller catch than the portfolio total implies, or it pays for several intakes and the conveyance between them. The portfolio figure of 148 Mm3/yr is not available at any one place, and the residual chapter must size against what a chosen intake can actually see, not against the sum.
Getting the water to the rock
Water can be taken from wherever there is plenty and piped to wherever it can be stored, so distance is a cost, not a veto. But shorter pipes are better, and the pairing that needs the least of them is worth knowing before anything is sized.
The first attempt at this measured each compartment’s distance to the nearest gauge, and it was misleading. A gauge is not an intake. The nearest gauge to A1 is 23.5 km away, so on that measure A1 has no resource within 20 km at all - while the river itself passes within 5.4 km, carrying 109 km2 of upstream catchment. The gauge-distance view understated every pairing here.
So the table below snaps each compartment to the nearest point on a real channel - the closest flow-accumulation cell carrying at least 50 km2 of upstream area, i.e. the nearest place a pump could stand - and asks the water layer what flows there, via core.availability.series_at().
| compartment | km2 | pipe km | upstream km2 | mean m3/s | Q95 m3/s | divertible Mm3/yr | worst year |
|---|---|---|---|---|---|---|---|
| A3 | 16 | 3.5 | 404 | 7.11 | 1.008 | 41.8 | WY2011 at 9% |
| A1 | 177 | 5.4 | 108 | 2.02 | 0.239 | 12.5 | WY2011 at 7% |
| A14 | 7 | 2.7 | 65 | 1.20 | 0.159 | 7.3 | WY2011 at 30% |
| A4 | 2 | 2.4 | 53 | 0.87 | 0.103 | 5.5 | WY2011 at 8% |
| A2 | 25 | 7.3 | 51 | 0.84 | 0.099 | 5.3 | WY2011 at 8% |
A3 is the best-placed store in the portfolio by a wide margin - 42 Mm3/yr on a channel 3.5 km away carrying 404 km2. It is also one of the smallest bodies at 16 km2. The registry’s designated target, A1, is seven times larger and sees roughly a third of the water.
That tension - the big rock is not where the big water is - is the central siting problem of this scheme, and it is not resolved in this chapter. Whether it matters depends on something the aquifer chapter decides: if a compartment’s usable capacity is set by well count and advective reach rather than by polygon area, then A1’s size advantage is largely notional and the well-placed small body wins. If capacity really does scale with area, the pipe is worth paying for.
Carry these numbers with their band.
series_at()returns volume with a 15% median bias (75% worst); timing is the reliable part, volume is not. Its window also begins 2012-01-01, because it is rainfall-driven, so the worst year it can see is WY2022 and not the WY2011 drought the gauge record contains. These figures rank pairings. They do not deliver water.
Straight-line distances, so they are a lower bound on pipeline length with no regard for terrain, lift or land.
What this chapter licenses, and what it does not
Licensed: a daily divertible-volume series per gauge over 2010-2026 on a stated licence definition, the seasonal shape of that resource, and its behaviour in drought. That is enough to drive the aquifer chapter and to bound the residual.
Not licensed:
- The absolute volume. Nine gauges measure 905 km2 of a 2,174 km2 contributing area. Roughly 1,329 km2 of ungauged catchment contributes nothing to these totals, so every figure above is an understatement of unknown size. The direction is deliberate and safe for a drought study - a scheme that works on these numbers works on the real river - but it is not a calibrated correction.
- Availability at an intake. These are gauge locations.
core.availability.series_at()will produce a series anywhere, and should be used once intakes are chosen, but it is driven by areal rainfall which begins 2012-01-01 and so cannot see the 2010-11 drought. The two tools answer different questions and neither replaces the other. - Stage. Nothing here says whether the water can physically be reached at a given bank level. Flow is not level and a rating does not regionalise.
- The licence itself. Q12.5/Q19 is a licence-shaped definition taken from the project’s existing runs. It is not an abstraction licence anyone has granted, and a real determination could be more or less generous.
- Tidal reaches. Below the tidal limit, level and discharge are set by the sea and the gates. No gauge here is tidal, but no intake sited downstream of one would be described by this chapter.