Banking winter water for a dry summer
Somerset has too much water in February and not enough in July. Can the surplus be caught and kept — in a reservoir, underground, or both — and given back when it is needed?
July 2026 has been the driest July in the seventeen-year record: 4.5 mm of rain against a July average of 57 mm. That is the problem in one number.
-
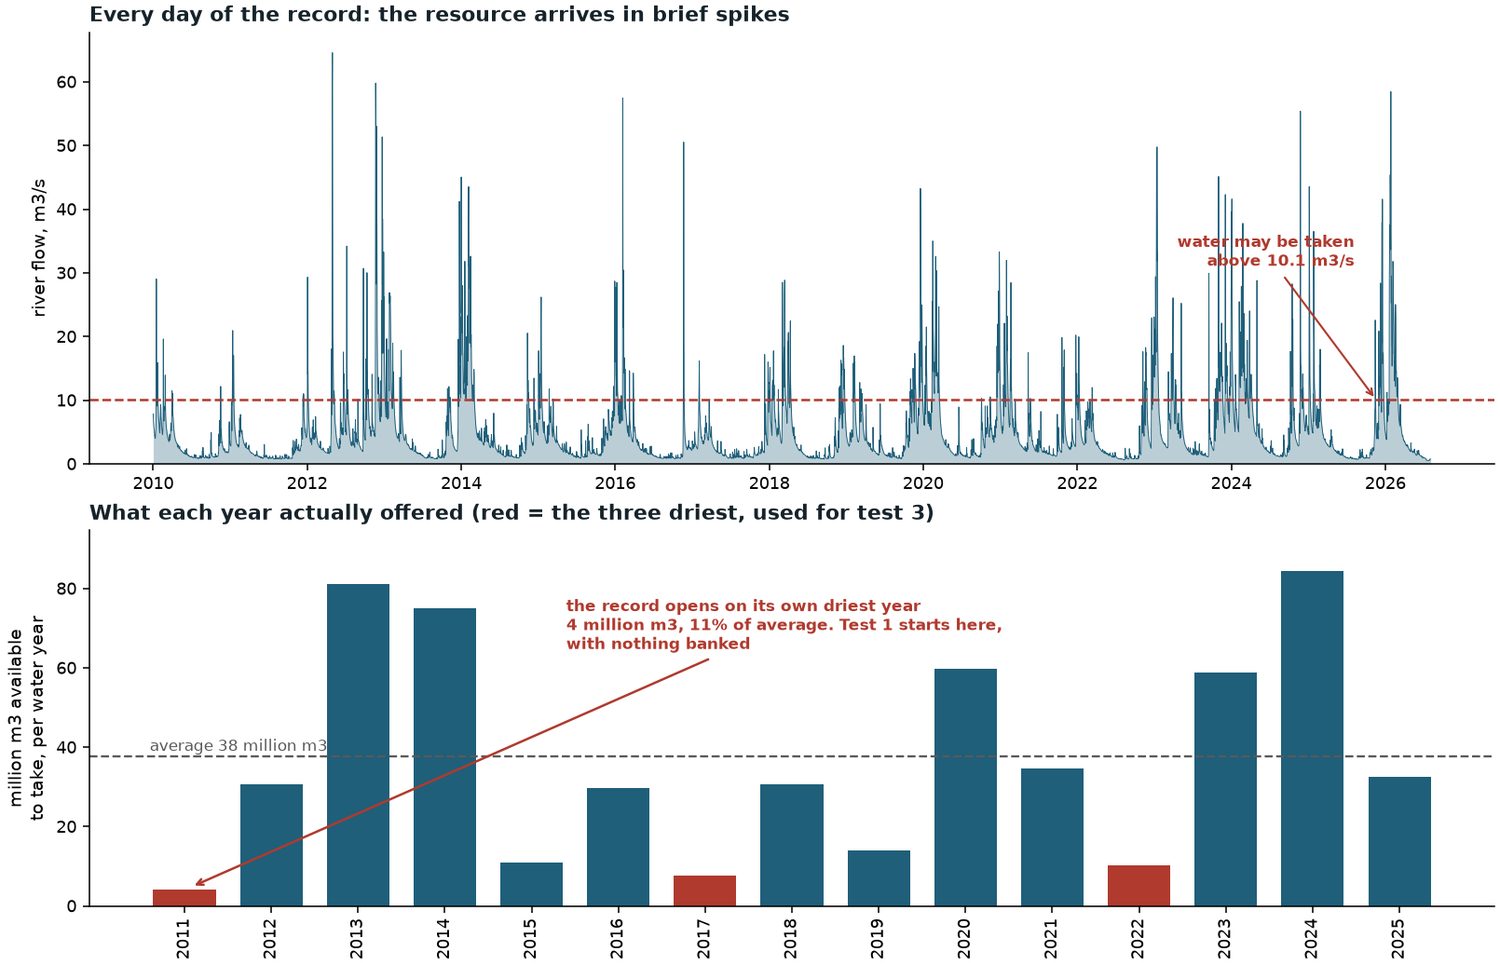
148 — million m³ a year could lawfully be taken at high flows
-
86% — of it arrives between November and March
-
2% — arrives in June, July and August, when it is wanted
-
9 — bursts a year, each lasting about two days
-
The water exists — many times more than any scheme here would use.
-
It arrives in short bursts. This, not the annual total, is what makes the engineering hard.
-
A reservoir alone cannot bridge a drought. It empties every summer and refills every winter, so it carries nothing from one year to the next. Underground storage can — if the water stays put.
-
The most promising options are not the obvious ones: a basin that fills itself by gravity, and flood-storage moors that already exist.
-
No scheme is being recommended here. Nothing in this study is costed.
Version 1 was circulated on 12 August. Five things have changed, and two of them are corrections rather than additions.
- A correction. Version 1 quoted a 389-day half-life beside a 15.7 million m³ capacity. Both were right for their own well field — one for a 1 km radius, one for 2 km — and wrong together. Everything is now quoted for the same 2 km field. No model run changed.
- A correction. Option E was described as pairing two different rocks. It was not: both its stores had the same rock and differed only in size. It has been rebuilt on two formations that really are different.
- Every rock body now carries a leakage figure. Version 1 left nine of fourteen blank. They are estimated from rock type and flagged as such — a blank read as “nothing is known”, which was not true.
- An eighth option, H: the same scheme as C on the best untested rock, to price what better ground is worth.
- New maps and charts: where each option would sit, what reaches the rivers, and how each scheme behaves through the year.
The ranking of the options is unchanged.
The current situation
The Somerset Levels flood in winter and run short in summer. Both happen for the same reason: the ground is flat, the rivers are slow, and the water arrives when nobody wants it.
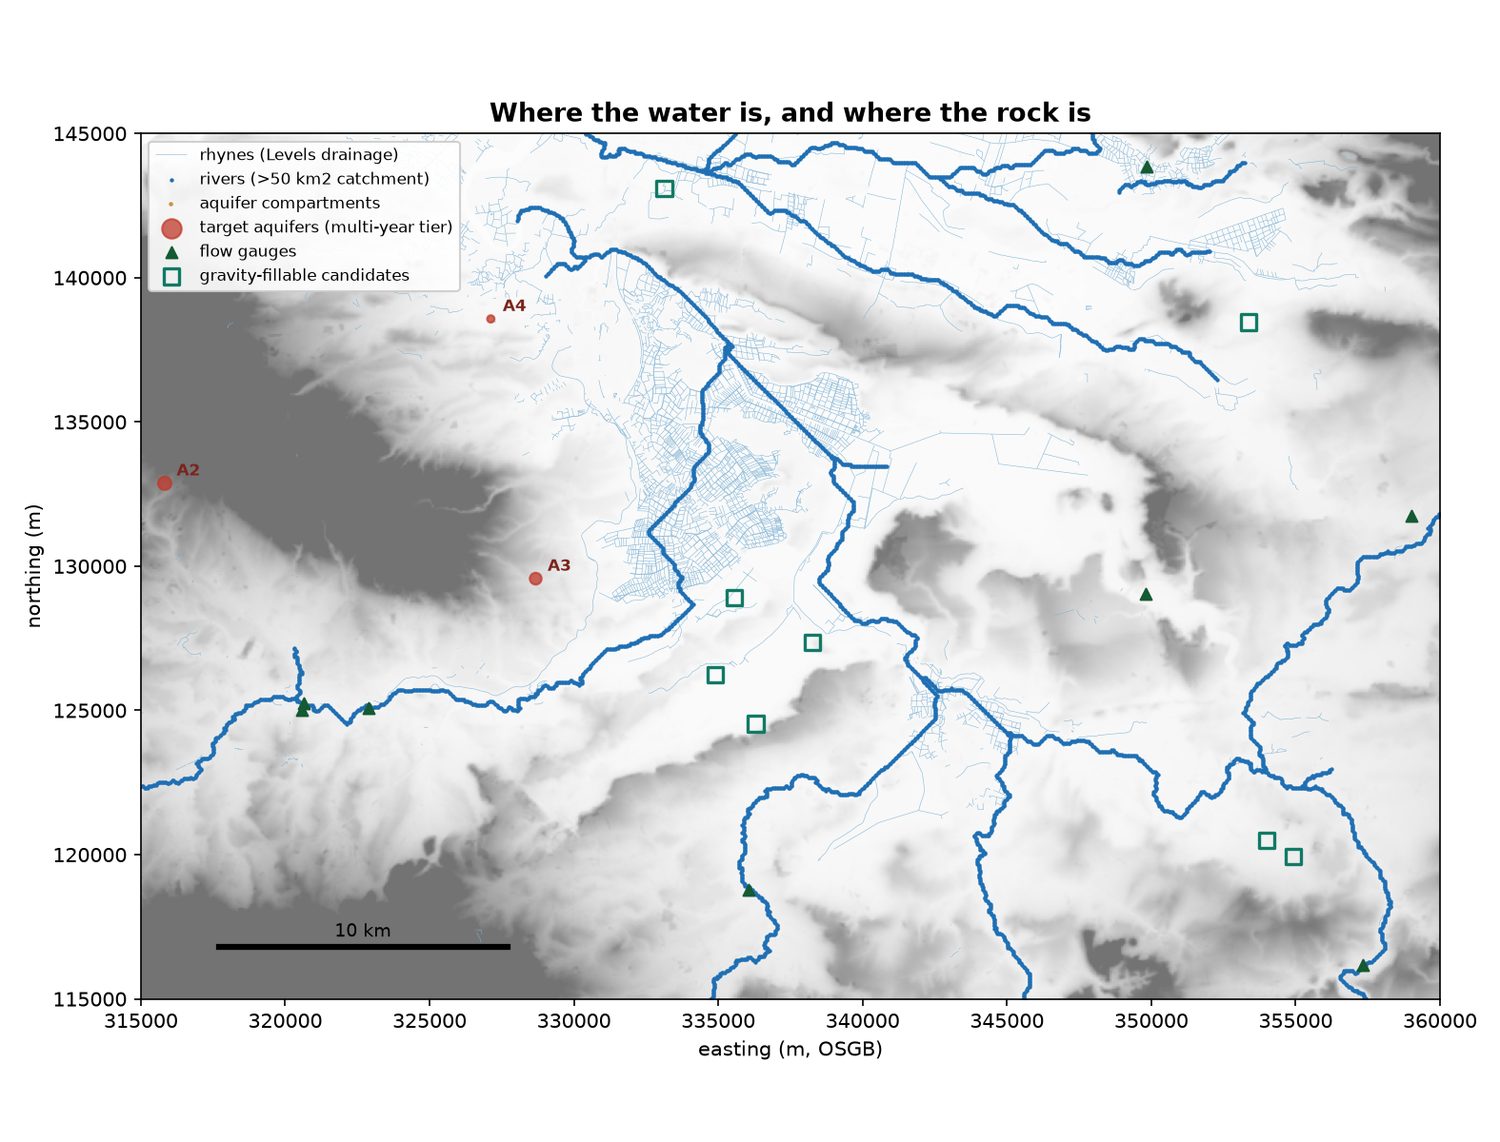
86% of the water that could lawfully be taken arrives between November and March. Only 2% arrives in June, July and August. Any scheme here is therefore a battery, not a tap: its job is to move water across six months, not to find more of it.
In a drought year there is very little to catch. The surplus is a winter thing — nearly all of it arrives between November and March — so a drought year here means a winter whose floods never came. In the worst year of the record only 21% of the average was available to take.
Water given out in a dry summer was caught the previous winter, or the one before that. It cannot be topped up during the drought, because the drought is the failure of the winter that would have filled it.
What limits a reservoir here
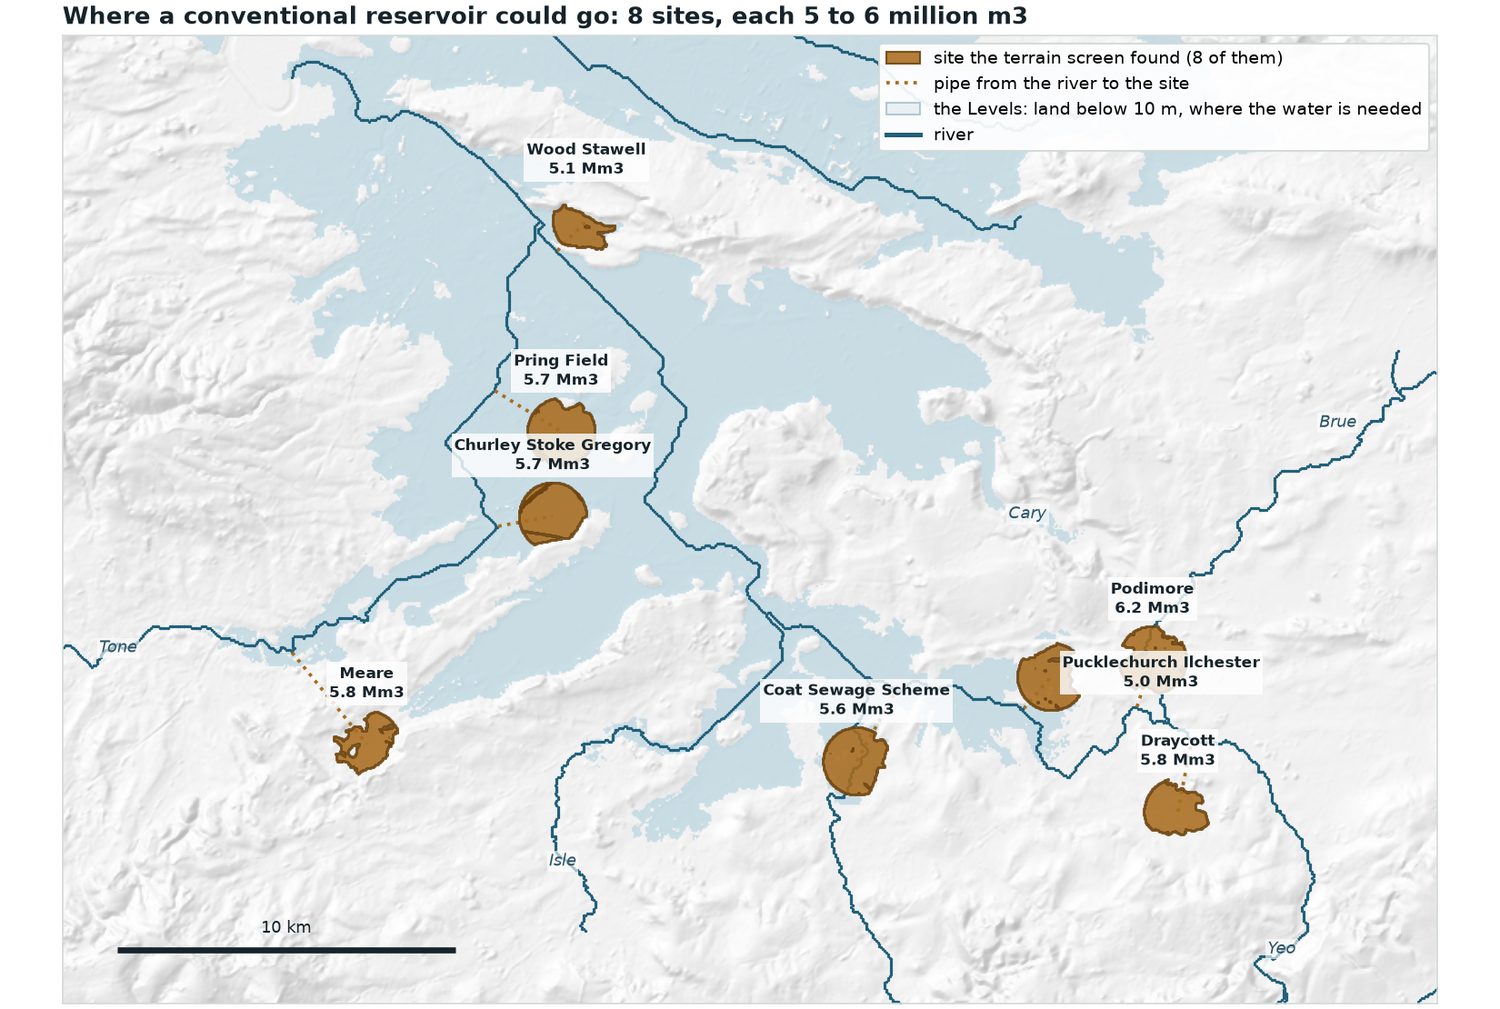
This is flat, low, soft ground with high land value and deep peat in places.
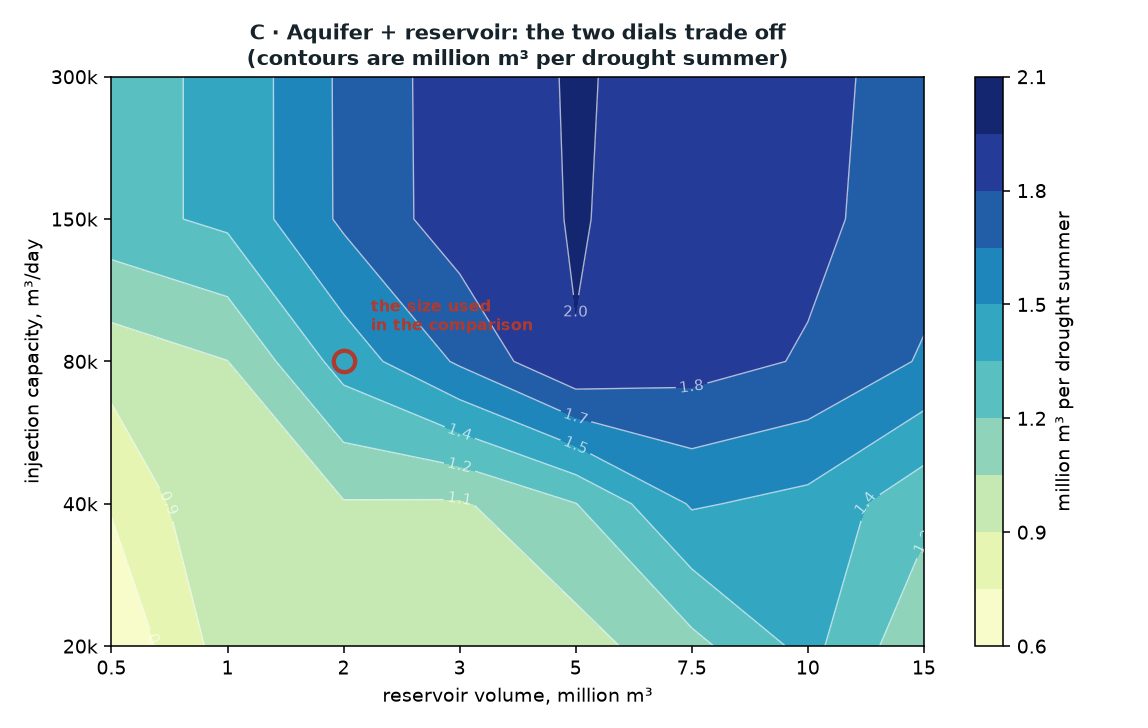
Much above 5 million m³ is taken to be an unrealistic cell on this ground. That is a judgement, not a calculation. It matters, because to stop losing water over the spillway entirely you would need around 10 million m³ — so a reservoir here will always take a share of the winter surplus.
What limits an aquifer
Water can also be put underground into porous rock and pumped back later. This is done elsewhere; the largest UK example supplies London. Underground storage does not evaporate and can hold water between years — but:
- It leaks. Water spreads away from where you put it. A 2 km well field in the local sandstone loses half of what is in it in about four years; a smaller field loses it faster, and the same rock can be either.
- It is fullest when you want to fill it. The water table peaks in February, exactly when the surplus arrives.
- Nothing in seventeen years of local records contains an injection.
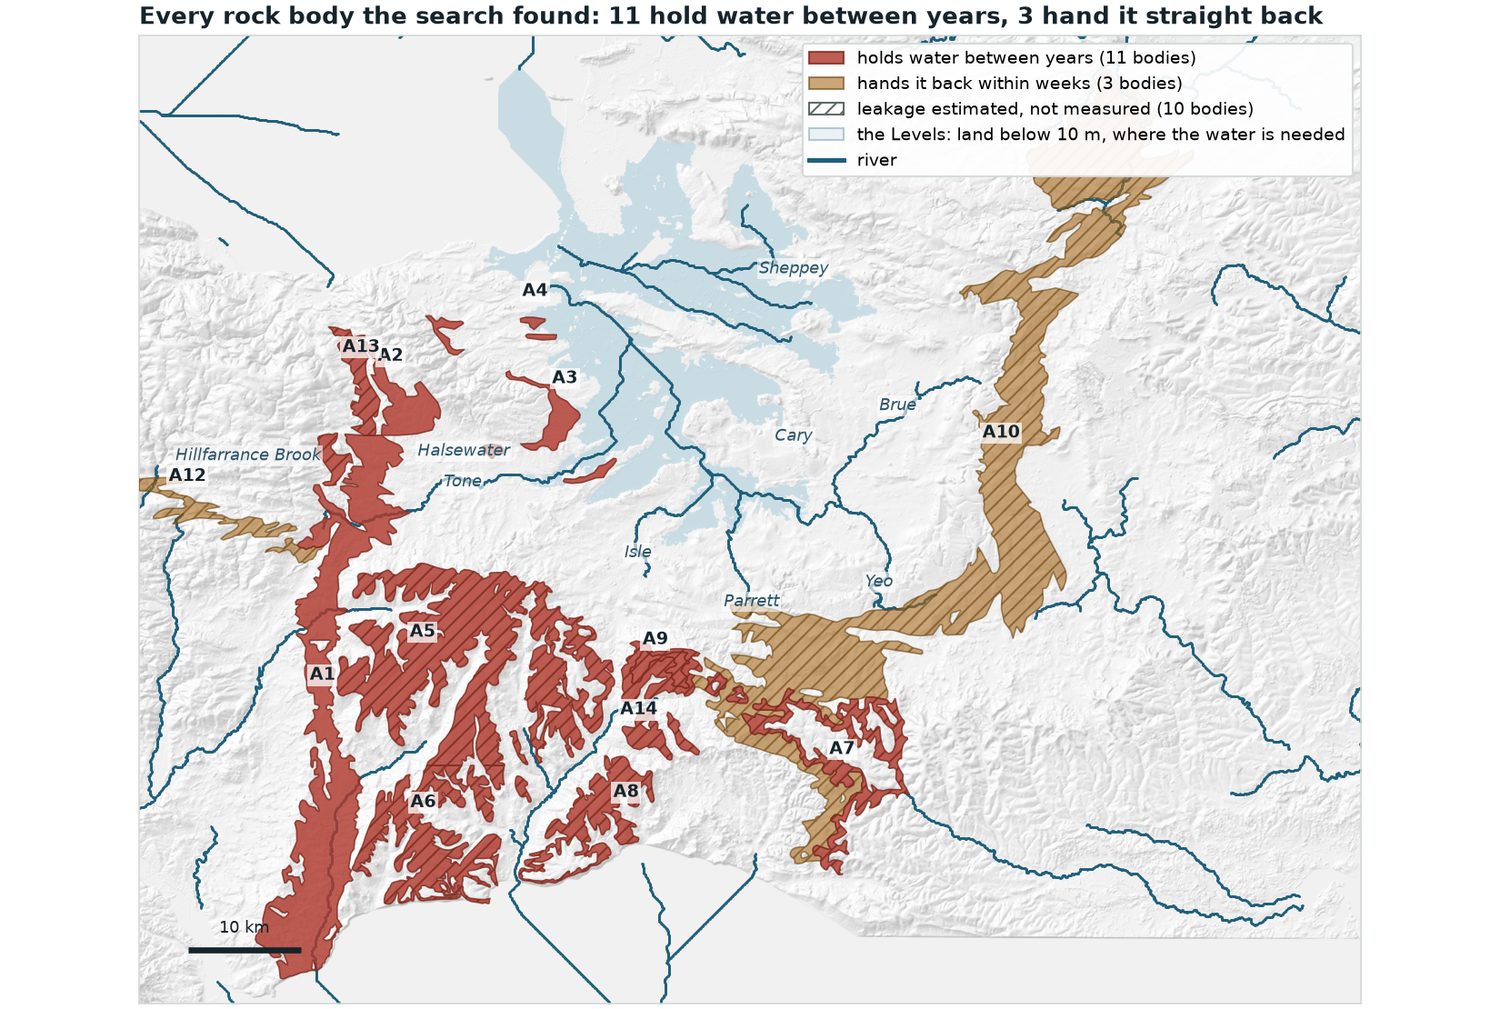
The table below is every body, with the same 2 km well field assumed on each so the rows can be compared.
| Body | Rock | Size | Distance to a river | Half the water has spread away in | What that well field holds | Where the figures come from |
|---|---|---|---|---|---|---|
| A5 | Upper Greensand Formation | 203 km² | 0.1 km | 6 years | 18.8 Mm³ | guessed |
| A1 | Helsby Sandstone Formation | 177 km² | 0.0 km | 4 years | 15.7 Mm³ | measured |
| A6 | Upper Greensand Formation | 72 km² | 0.7 km | 6 years | 18.8 Mm³ | guessed |
| A7 | Upper Greensand Formation | 45 km² | 0.0 km | 6 years | 18.8 Mm³ | guessed |
| A8 | Upper Greensand Formation | 39 km² | 0.2 km | 6 years | 18.8 Mm³ | guessed |
| A9 | Upper Greensand Formation | 32 km² | 0.2 km | 6 years | 18.8 Mm³ | guessed |
| A2 | Helsby Sandstone Formation | 25 km² | 4.4 km | 4 years | 15.7 Mm³ | measured |
| A13 | Exeter Group | 22 km² | 2.2 km | 5 years | 22.6 Mm³ | inferred |
| A3 | Helsby Sandstone Formation | 16 km² | 0.5 km | 4 years | 15.7 Mm³ | measured |
| A14 | Chalk (Salisbury Plain body) | 7 km² | 1.8 km | 2 days | 0.2 Mm³ | guessed |
| A4 | Helsby Sandstone Formation | 2 km² | 2.6 km | 4 years | 15.7 Mm³ | measured |
| A10 | Great Oolite Group | 408 km² | 0.0 km | 30 days | 2.5 Mm³ | guessed |
| A12 | Carboniferous Limestone Supergroup | 21 km² | 0.0 km | 15 days | 1.3 Mm³ | guessed |
| A11 | Great Oolite Group | 1 km² | 3.4 km | 30 days | 2.5 Mm³ | guessed |
Size of body barely matters; kind of rock matters a lot. Underground storage is not a tank filled to the edges of the rock. It is a mound of water around a ring of wells, so its volume is set by the ring and by what the rock will give up — not by how much rock there is. The 408 km² Oolite body and the 1 km² one offer the same 2.5 Mm³ to the same well field. But the Greensand offers 18.8 and the limestones 1–2, because they differ in how much water drains out of them.
Only the sandstone rests on measured figures. Every other row is estimated from rock type — a fair guess a geologist could argue with, not a measurement, and the last column says which is which. Earlier versions of this report left those cells blank. That was worse: a blank reads as “nothing is known”, and something is.
Read that way the table stops being a shortlist and starts being a question. On these estimates the Greensand and the Exeter Group hold more, and hold it longer, than the sandstone the whole study is built on — and the limestones drain in weeks. If those estimates are anywhere near right, the rock this study picked is not obviously the best one. Nobody has measured them, and that is the point.
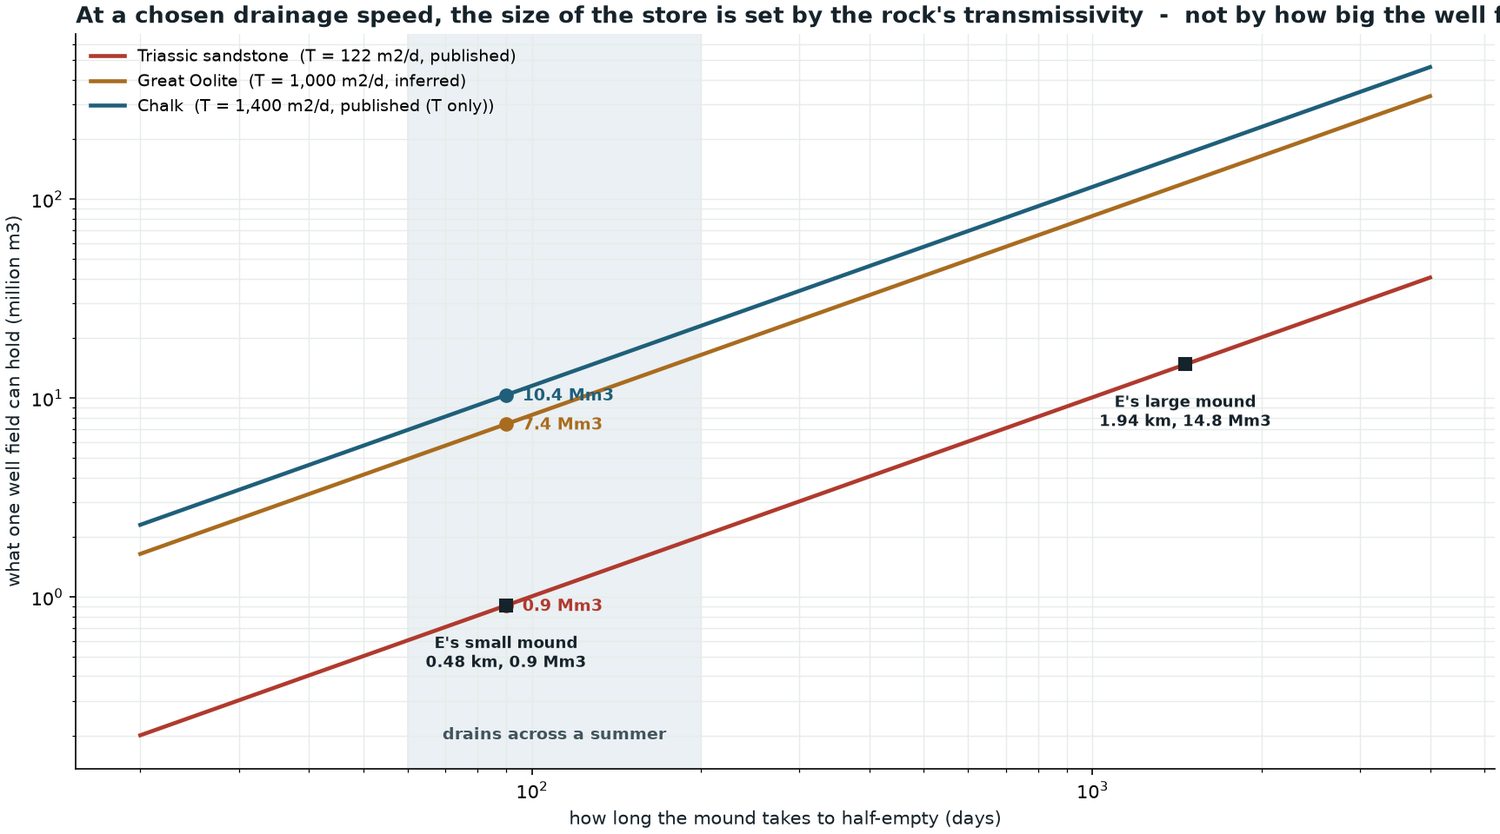
Work the leakage and the capacity together and the well-field radius drops out, and so does specific yield. What a store can hold at a chosen drainage speed depends on just two things: the transmissivity of the rock, and how far you may raise the water table. Both enter linearly.
At a 90-day drainage speed — roughly “empties over a summer” — that gives:
- Triassic sandstone (T = 122, published) — 0.9 Mm³.
- Great Oolite (T = 1,000, estimated) — 7.4 Mm³, eight times as much, needing a 3.4 km field that the 408 km² body has room for.
- Chalk (T = 1,400, published) — 10.4 Mm³ in principle, but the 7 km² body here is too small and the wrong shape to hold a 1.5 km field.
So a fast-draining store is not necessarily a small one. It is small in this sandstone. On rock eight times as transmissive the same drainage speed holds eight times the water.
What the rock would actually accept is the largest single uncertainty in this study, and it is not resolved here. What the model does instead is avoid depending on it: no number in this report rests on predicting the rate — where an injection rate is needed a bound is used, and stated.
The three tests
Every option faces the same three tests.
| Test | What it asks |
|---|---|
| 1. As built | A scheme switched on in 2010 with empty stores. The record opens on its own driest year, so this is a hard start — and a fair one. |
| 2. Mature | The same seventeen years with stores already full, as for a scheme running a decade. The gap between 1 and 2 is the cost of being new. |
| 3. Six droughts | The three driest years stitched back to back and run twice. Every day really happened; only the order is invented. |
Test 3 is a stress test, not a forecast. Nothing here claims how likely such a sequence is.
The one number to hold on to
Every option below is reported the same way, and it is worth fixing what the figure means before meeting it:
Million m³ delivered per drought summer — water put on fields or into low rivers between April and September of a dry year, averaged over the four driest years in the record.
Alongside it sits the percentage of those days on which a survival ration is met — enough to keep a crop alive rather than to grow it well. The volume says how much; the percentage says how reliably.
For scale: the whole area’s licensed agricultural abstraction is about 3 million m³ a year. So an option delivering 1 million m³ in a drought summer is meeting roughly a third of a normal year’s licensed demand at the moment it is hardest to supply.
What is modelled, and what it is built from
A reader entitled to be suspicious should be able to see what is measurement, what is modelling, and what is assumption.
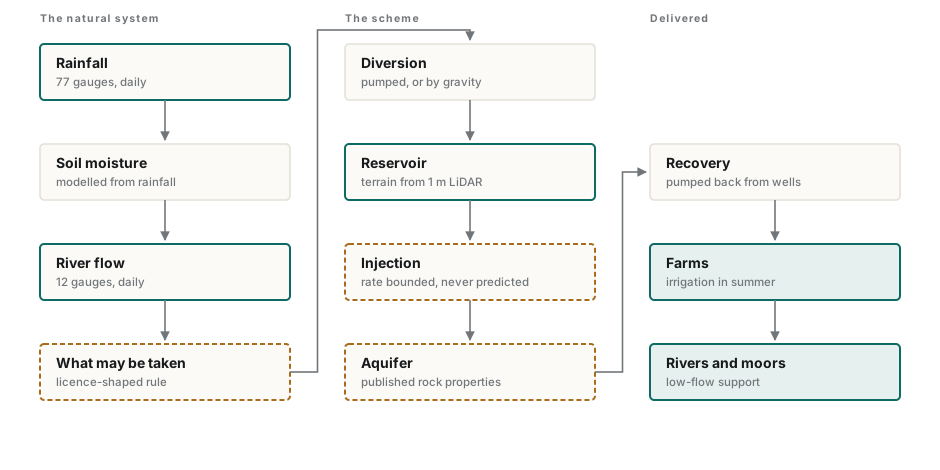
| What | Source | How good |
|---|---|---|
| Rainfall | 77 EA gauges, 2010–2026 | Measured |
| River flow | 12 EA gauges, daily | Measured |
| Terrain | 1 m LiDAR | Measured |
| Geology | BGS mapping and borehole logs | Mapped, interpreted for this study |
| Rock properties | BGS report WD/97/34 | Published, not site-specific |
| Land use | Crop Map of England 2024 | Satellite classification, confidence 0.49 |
| Abstraction licences | EA register, one 100 km² window | Measured, small sample |
| Moor water levels | Water Level Management Plans | Published, 2009–11 vintage |
What turned out not to need modelling
Demand is not the constraint. Licensed agricultural abstraction is 2.3–3.2 million m³/yr. The water that could physically do good on the arable land alone is about 108 million m³/yr. The licence is under 1% of what would be useful — so no option here is limited by whether anyone wants the water. They are all limited by how much can be caught and kept.
The honest ledger
Real trade-offs — physical, and they will not go away
| Trade-off | Why |
|---|---|
| Big well field vs small | Large fields hold water longer but cost more and may not fit the rock body |
| Reservoir vs wells | A reservoir is fast and expensive; the ground is slow and cheap |
| One large site vs several | Several catch more water; each needs its own land, consent and plant |
| Catching floods vs holding levels | A basin kept empty catches more but is useless as a landscape feature |
Model assumptions — choices behind the numbers
| Assumption | Value | Effect if wrong |
|---|---|---|
| Reservoir realistically buildable | ≤5 Mm³ | Shifts the balance between surface and underground storage |
| Rock porosity and transmissivity | Published regional values | Scales every underground number |
| Leaked water returning to rivers | 80% | Tested: changes answers by 1–3%. Not a risk |
| Settling time before injection | 2 days | Sets a minimum basin size, ~0.3 Mm³ |
| Flood depth above channel bed | 2 m | The most influential guess here — it decides which sites can fill by gravity |
Known unknowns
- What the rock will accept when injected. No local precedent — and the model holds that rate fixed across every rock, so a more transmissive body gets no credit for accepting water faster, which is the main thing that would shrink the reservoir in front of it.
- Whether injection wells would clog — the usual failure mode of such schemes, and not modelled at all.
- Costs. Nothing here is costed. Every comparison is “X delivers more water than Y”, never “X is better value”.
The eight options
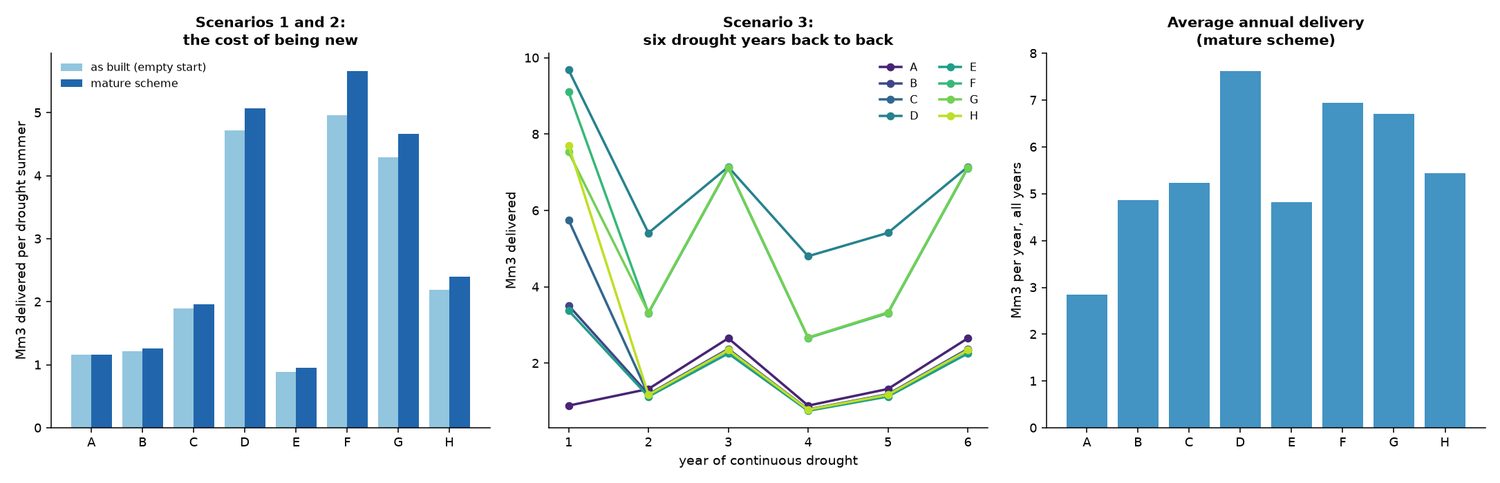
| Option | Reservoir | As built | Mature | % of days | To rivers | Drought yr 1 | Yrs 2–6 |
|---|---|---|---|---|---|---|---|
| A Reservoir only (3 Mm3) | 3 Mm³ | 1.16 | 1.16 | 18% | 0.00 | 0.89 | 0.9–2.7 |
| B Aquifer only, direct injection | 0.3 Mm³ | 1.22 | 1.26 | 21% | 0.38 | 3.51 | 0.8–2.4 |
| C Aquifer + reservoir | 5 Mm³ | 1.90 | 1.96 | 32% | 0.49 | 5.75 | 0.8–2.3 |
| D Three sites, three rivers | 2 × 3 Mm³ | 4.72 | 5.07 | 78% | 2.51 | 9.68 | 4.8–7.1 |
| E Fast rock + slow rock, cascaded | 2 Mm³ | 0.89 | 0.96 | 16% | 0.50 | 3.38 | 0.8–2.3 |
| F Gravity-filled basin | 5 Mm³ | 4.97 | 5.67 | 89% | 0.99 | 9.10 | 2.7–7.1 |
| G Existing flood storage moor | 3 Mm³ | 4.29 | 4.67 | 74% | 0.81 | 7.53 | 2.7–7.1 |
| H The best untested rock | 5 Mm³ | 2.19 | 2.40 | 39% | 0.39 | 7.70 | 0.8–2.3 |
Each option below has a small map. Two conventions run through all of them.
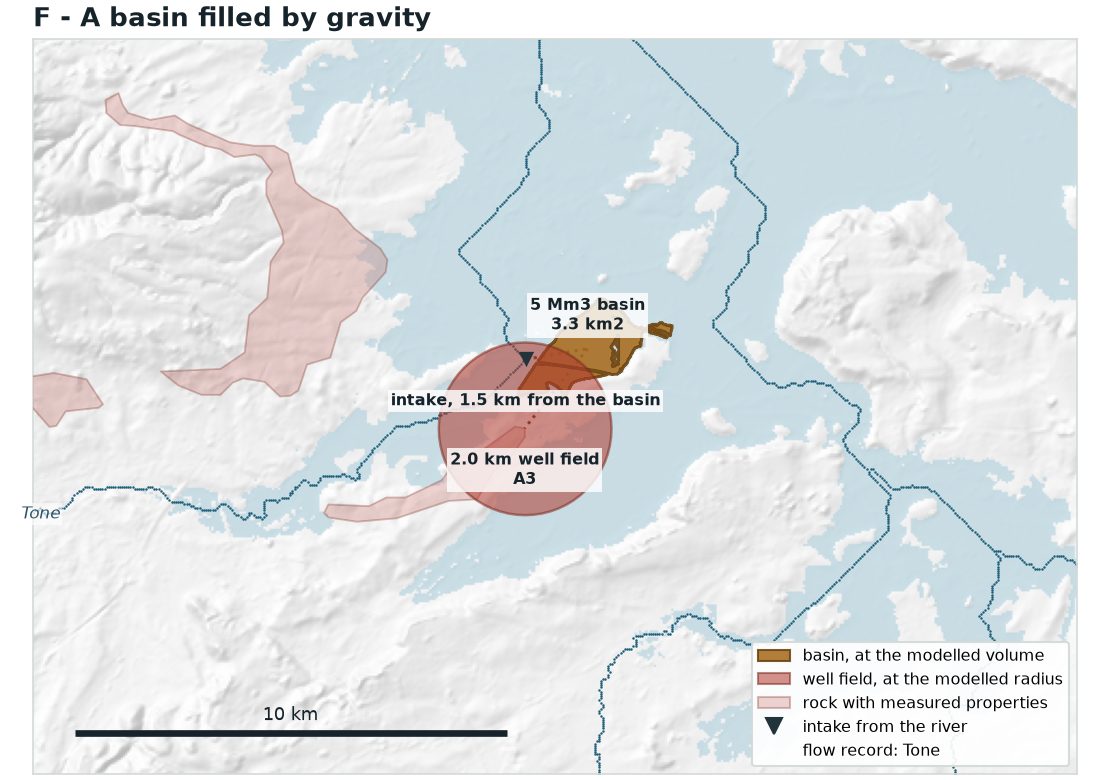
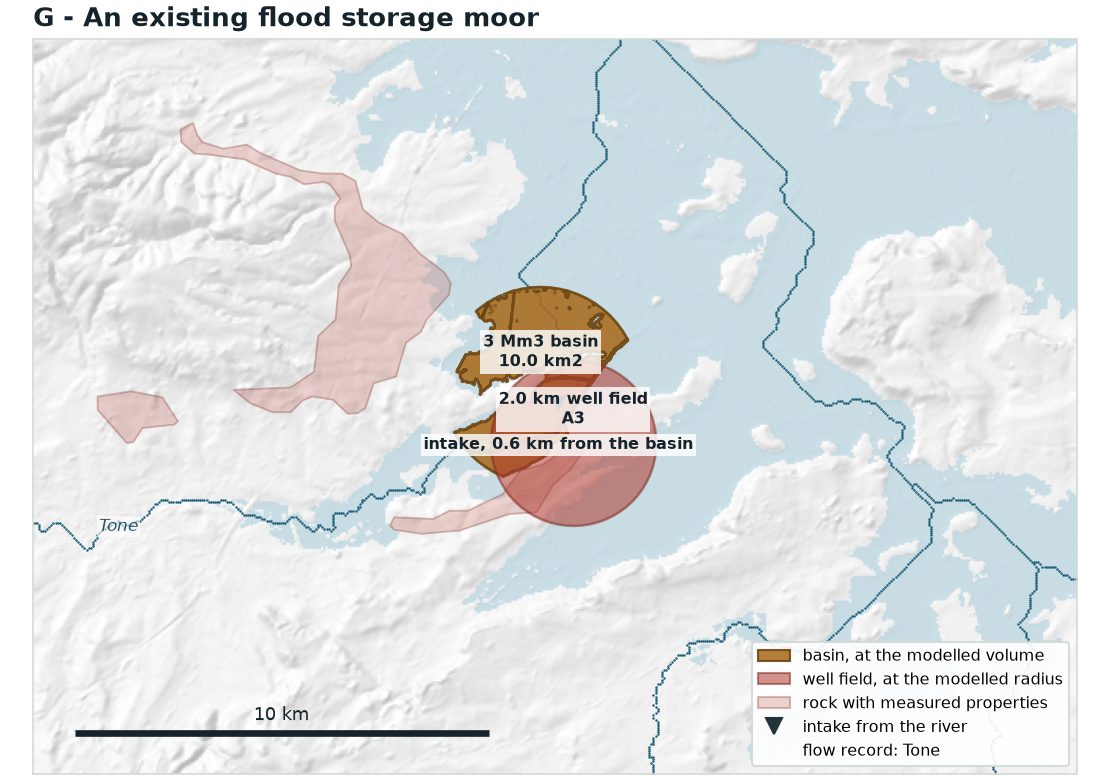
The basin follows the ground. It is drawn as the water surface the terrain would actually hold at that volume, which is why it is never a neat shape. Options F and G are the exception: they are sited rather than screened, and are drawn as a disc of the right area.
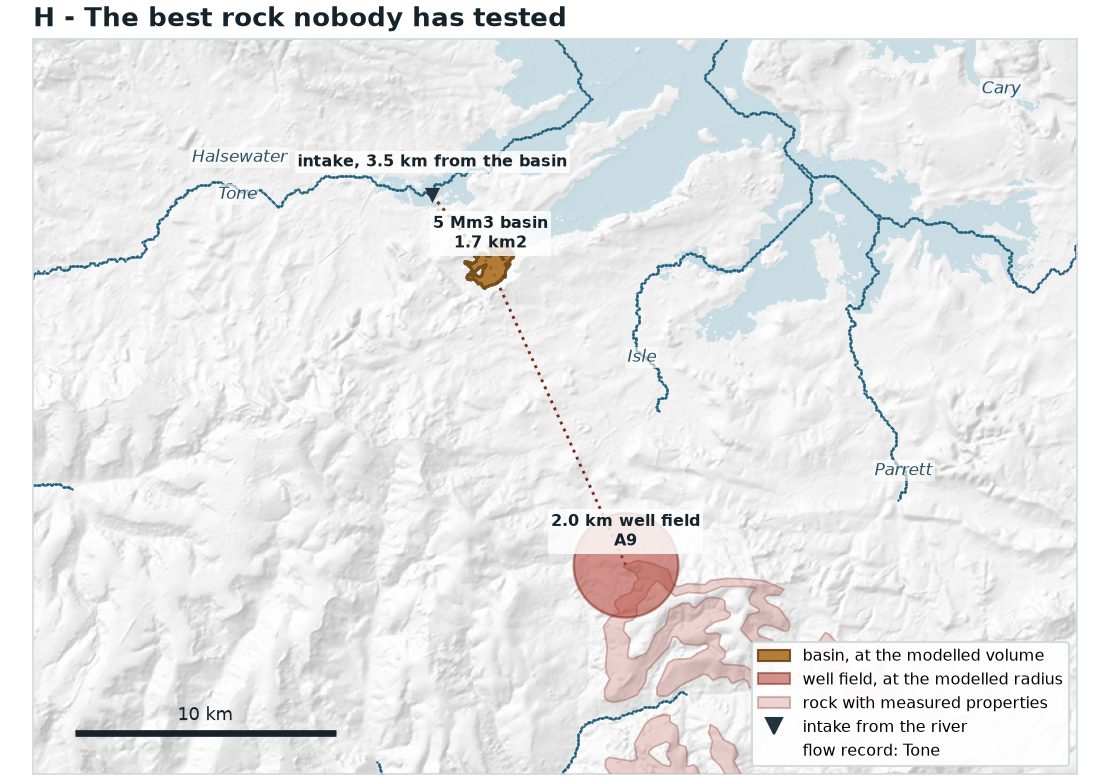
The well field is the mound, not a fence line. It is drawn at the radius the model gives it, centred on the nearest suitable rock. Where the mound is wider than the outcrop, that is a real consequence of the modelled radius rather than a drawing error.
The model sizes schemes; it does not site them. So the positions are indicative. The sizes, the radii, which rivers are in play and which rock is being recharged are not.
A · Reservoir only
| Component | Specification |
|---|---|
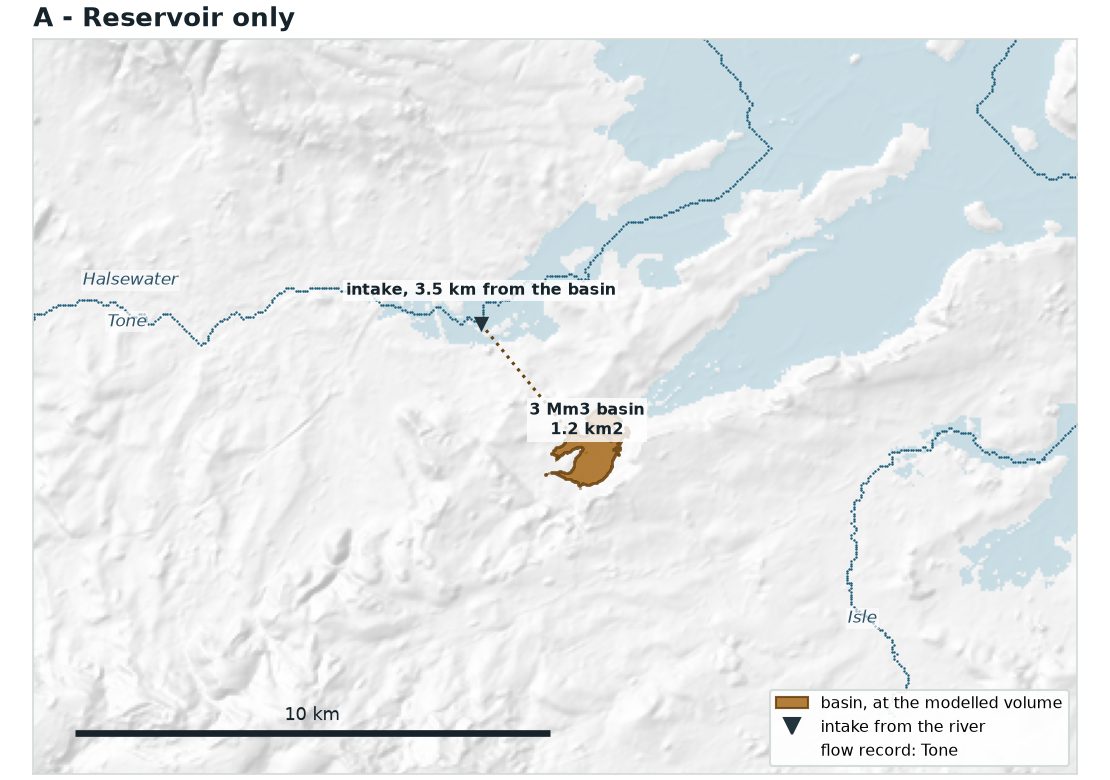
| Reservoir | 3 million m³, about 1 km² at 3 m deep |
| Aquifer | none |
| Intake | 150,000 m³/day, pumped from the Tone |
| Supply | 40,000 m³/day from basin to fields |
| Pipework | 3.5 km river to basin, plus distribution |
**1.16 million m³ per drought summer** — enough to cover **18%** of drought-summer days with a survival ration. A basin caught from the river in winter and drawn down through the summer, with no underground storage at all. It gains nothing whatever from being mature, because it has no memory between years.
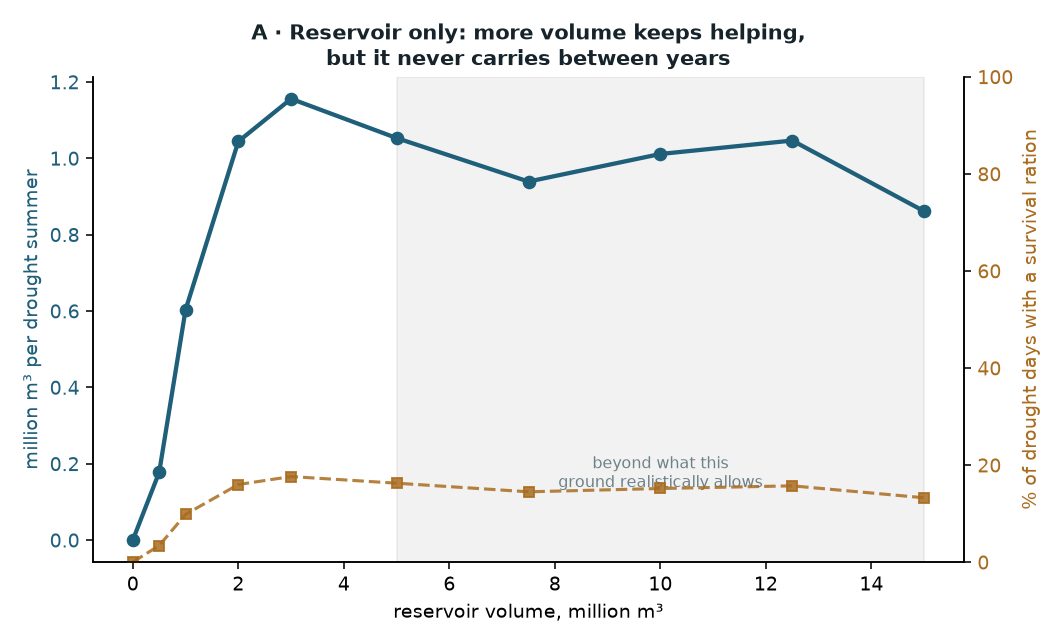
Its six-year drought trace is worth a second look: 0.89, 1.33, 2.65, 0.89, 1.33, 2.65. Exactly periodic — year four is identical to year one because nothing carried over. If the objective is resilience across years, surface storage alone cannot provide it at any size this ground allows.
B · Aquifer only, no reservoir
| Component | Specification |
|---|---|
| Reservoir | 0.3 million m³ settling pond only |
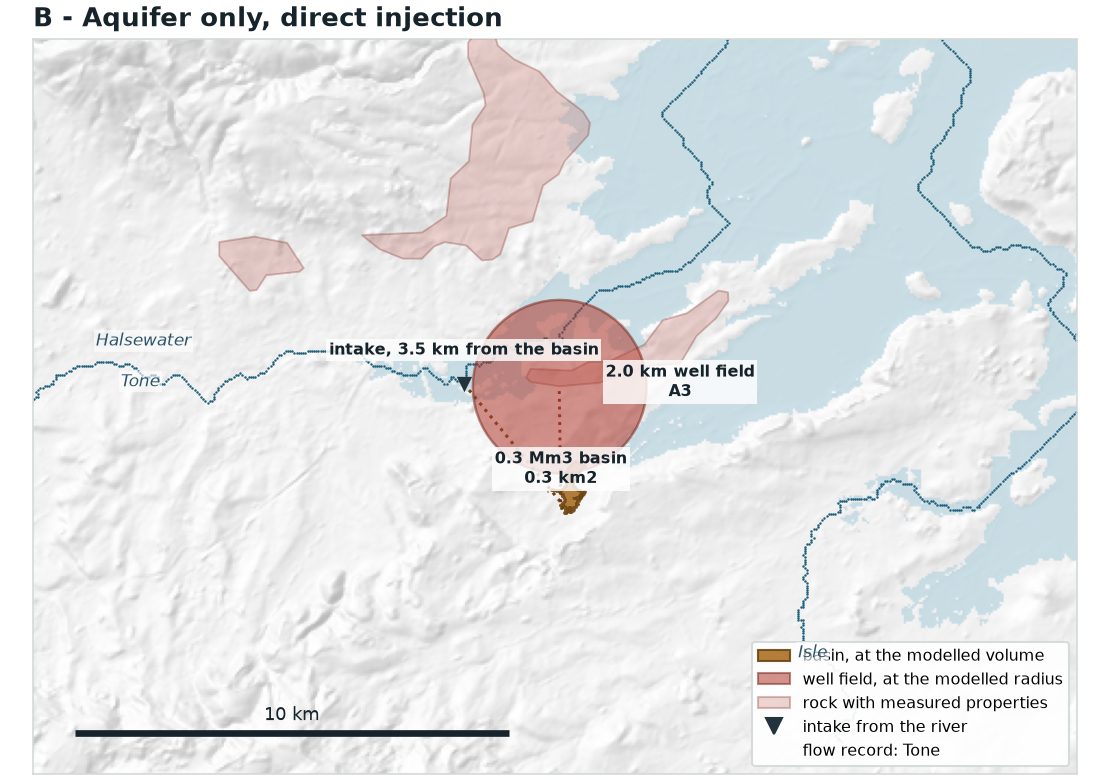
| Aquifer | 2 km well field in sandstone, ~16 Mm³ |
| Intake | 150,000 m³/day, straight to the wells |
| Injection | 150,000 m³/day |
| Recovery | 40,000 m³/day |
| Pipework | 3.5 km river to basin; 2.7 km basin to well field |
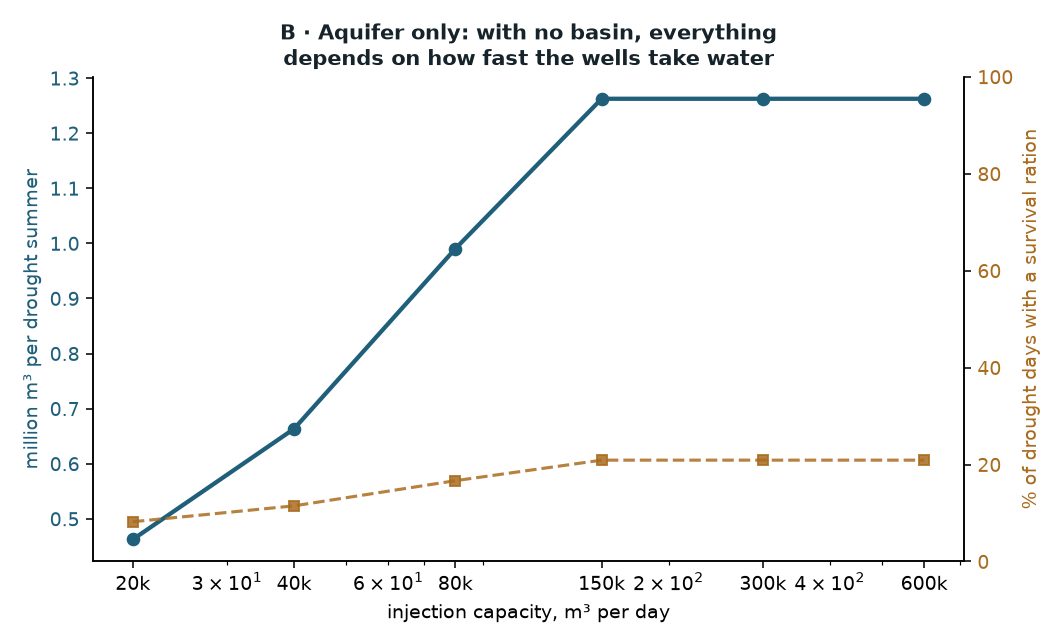
**1.26 million m³ per drought summer** — enough to cover **21%** of drought-summer days with a survival ration. River water pumped straight down wells with no basin at all. The cheapest thing to build, but it can only take water while the river is high, and it sends barely-settled flood water into the wells — the arrangement most likely to clog them.
C · Aquifer + reservoir
| Component | Specification |
|---|---|
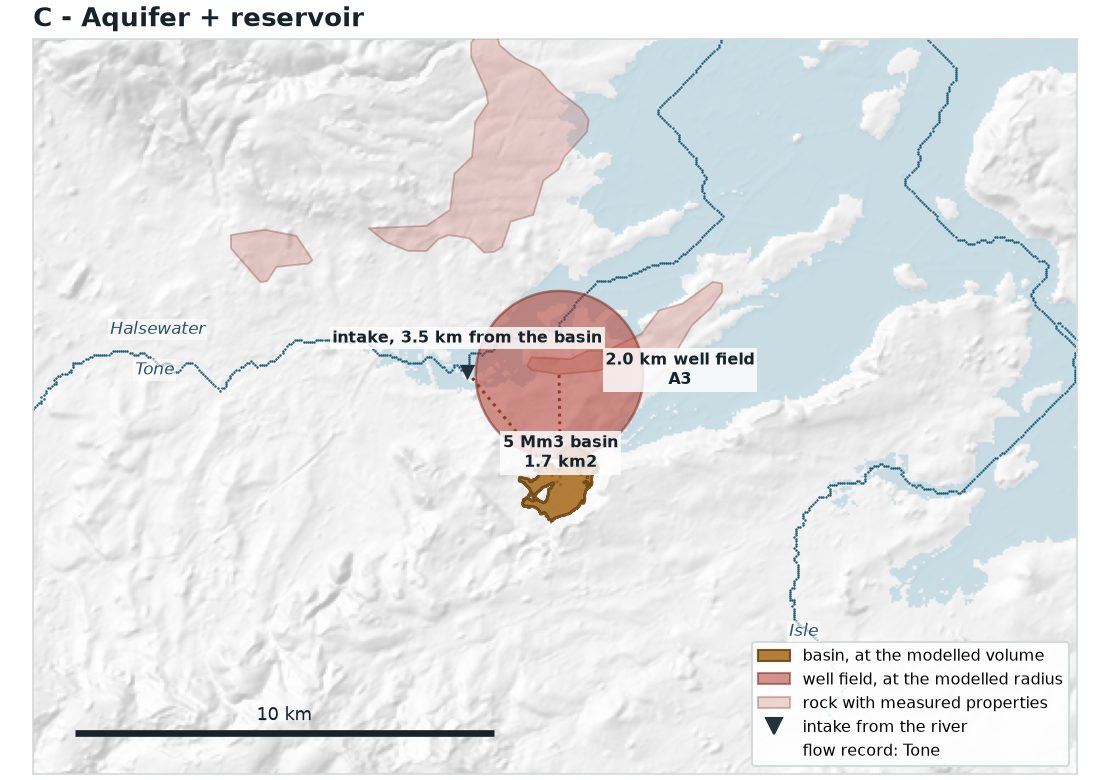
| Reservoir | 5 million m³, ~1.7 km², 2 days settling |
| Aquifer | 2 km well field, ~16 Mm³ capacity |
| Intake | 150,000 m³/day, pumped |
| Injection | 150,000 m³/day |
| Recovery | 40,000 m³/day |
| Pipework | 3.5 km river to basin; 2.7 km basin to well field |
**1.96 million m³ per drought summer** — enough to cover **32%** of drought-summer days with a survival ration. The conventional managed-recharge scheme: catch the flood in a basin, inject it underground over the following weeks, pump it back in summer. Better than either part alone, and unlike a reservoir it carries water between years. **This is the baseline everything else should be judged against.**
D · Three sites on three rivers
| Component | Specification |
|---|---|
| Reservoirs | 3 × 2 million m³, one per river |
| Aquifers | 3 × 1.15 km well field, ~5 Mm³ each |
| Intakes | 3 × 150,000 m³/day — Tone, Isle/Parrett, Brue/Yeo |
| Injection | 27,000 m³/day per site |
| Recovery | 13,000 m³/day per site |
| Pipework | 3 separate systems — 0.1–3.5 km river to basin; 2.7–11.8 km basin to well field |
**5.07 million m³ per drought summer** — enough to cover **78%** of drought-summer days with a survival ration. Three separate schemes of the same kind as C, one on each of three river systems, sharing the same total well capacity. Here the landscape does the design rather than a dial. It works for one simple reason — *the rivers do not flood on the same days*, so three modest intakes are busy more often than one large one.
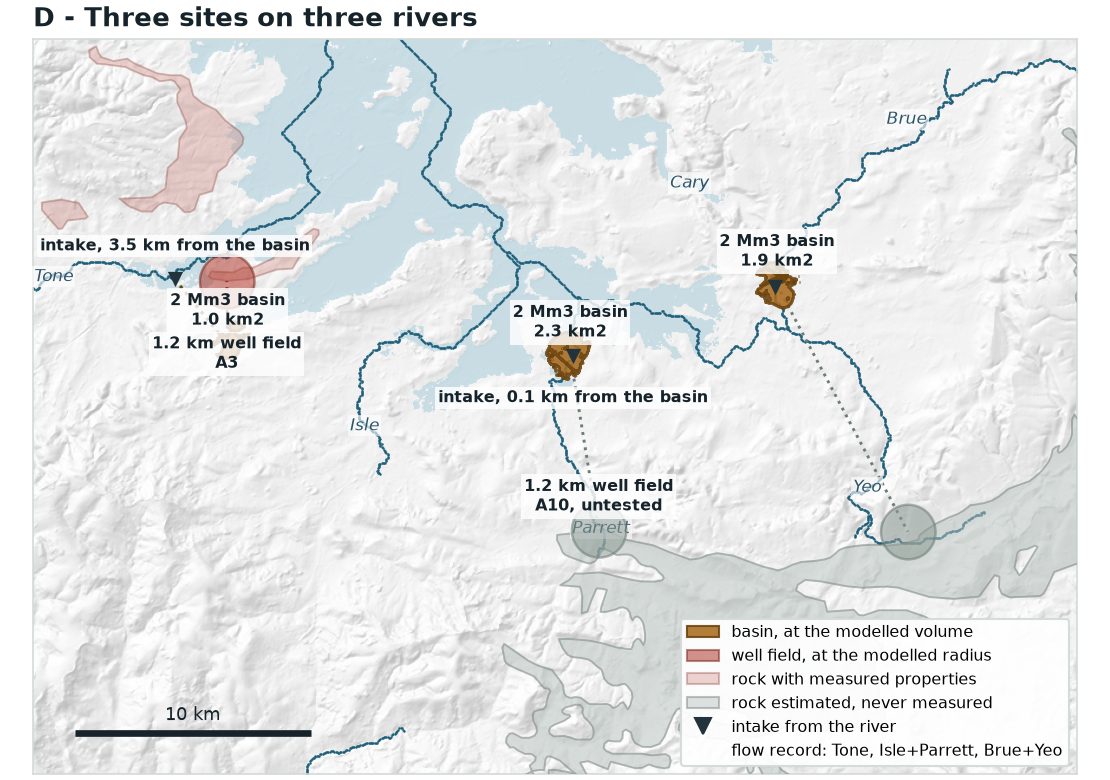
The three sites are not equivalent. All three are modelled on Triassic sandstone, and the only Triassic sandstone in the study area is in the west — so the western site’s wells are 2.7 km from its basin while the two eastern ones are 12 and 20 km away. There is rock beneath the eastern rivers, but it is Greensand and Oolite, and no leakage figure has been derived for either.
D’s strength does not depend on this. It works because three rivers do not flood on the same days, and that stands whatever the rock does. What the map adds is where the cost and the uncertainty sit: either long pipes west, or the first leakage test on an eastern body.
E · Fast rock and slow rock, linked
| Component | Specification |
|---|---|
| Reservoir | 2 million m³ |
| Fast store | Great Oolite, 3.44 km mound, 7.4 Mm³, 90-day half-life |
| Slow store | Upper Greensand, 2.0 km mound, 18.8 Mm³, 6.3-year half-life |
| Rock | two touching outcrops, both on a river — but both estimated, never measured |
| Transfer | 30,000 m³/day, fast store to slow |
| Intake | 150,000 m³/day |
**0.96 million m³ per drought summer** — enough to cover **16%** of drought-summer days with a survival ration. Two genuinely different rocks working together: fractured limestone that drains over a summer to feed the rivers naturally, passing the rest into sand that holds water for years. **Still the worst performer here, and that is the finding.**
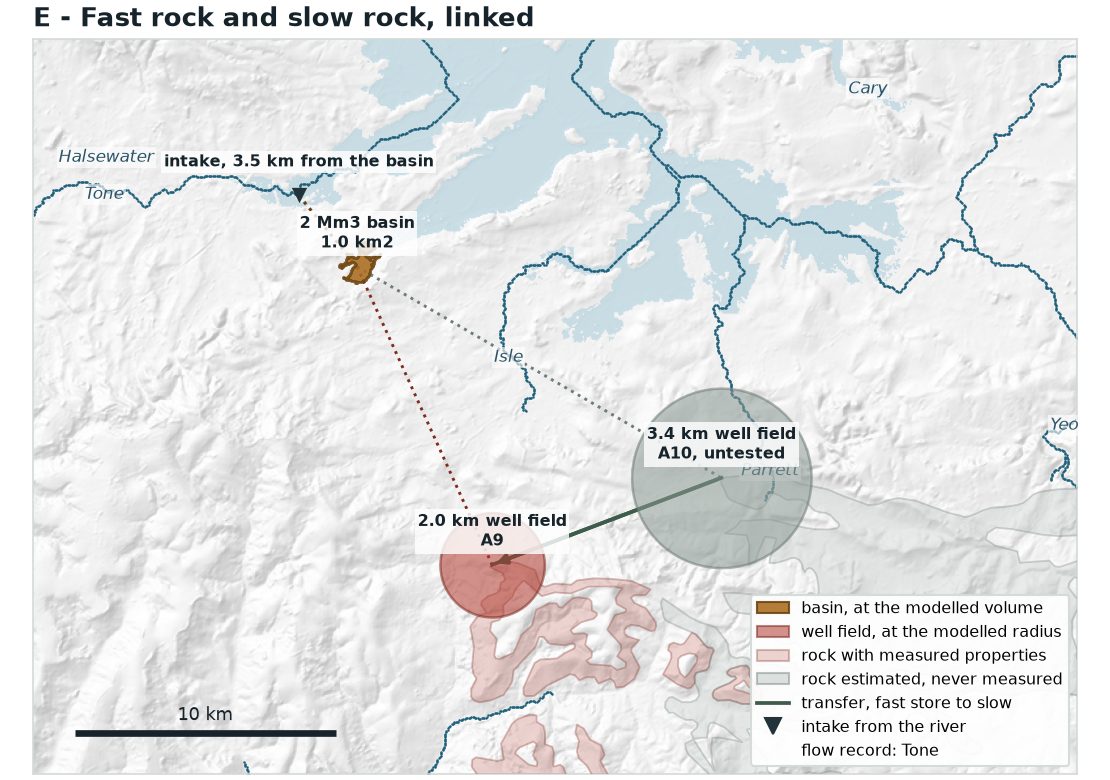
On the limestone, a store that drains over a summer holds 7.4 million m³ — eight times what the sandstone gives at the same speed. The pairing has the storage it always needed. It still comes last.
Not the rock, and not the plumbing. Look at when the leak happens. A store that half-empties in 90 days is filled by the winter floods and has given most of it back by May. Across the record E returns 0.50 million m³/yr to the rivers. In a drought summer it returns 0.01 — because in a dry year the fast store never filled either.
It feeds the rivers generously in wet years, when they do not need it, and has nothing left in dry ones, when they do. That is this report’s recurring sentence in its sharpest form: a drought is the failure of the winter that would have filled the store. A passive store cannot escape it, because passive means it drains on the calendar rather than on demand.
Would a slower store do better?
The obvious objection, and worth a sweep rather than an argument — because a slower store is not a smaller one. Volume rises in step with the half-life, so asking for 180 days instead of 90 doubles it rather than trading it away. There is no penalty to pay on that axis.
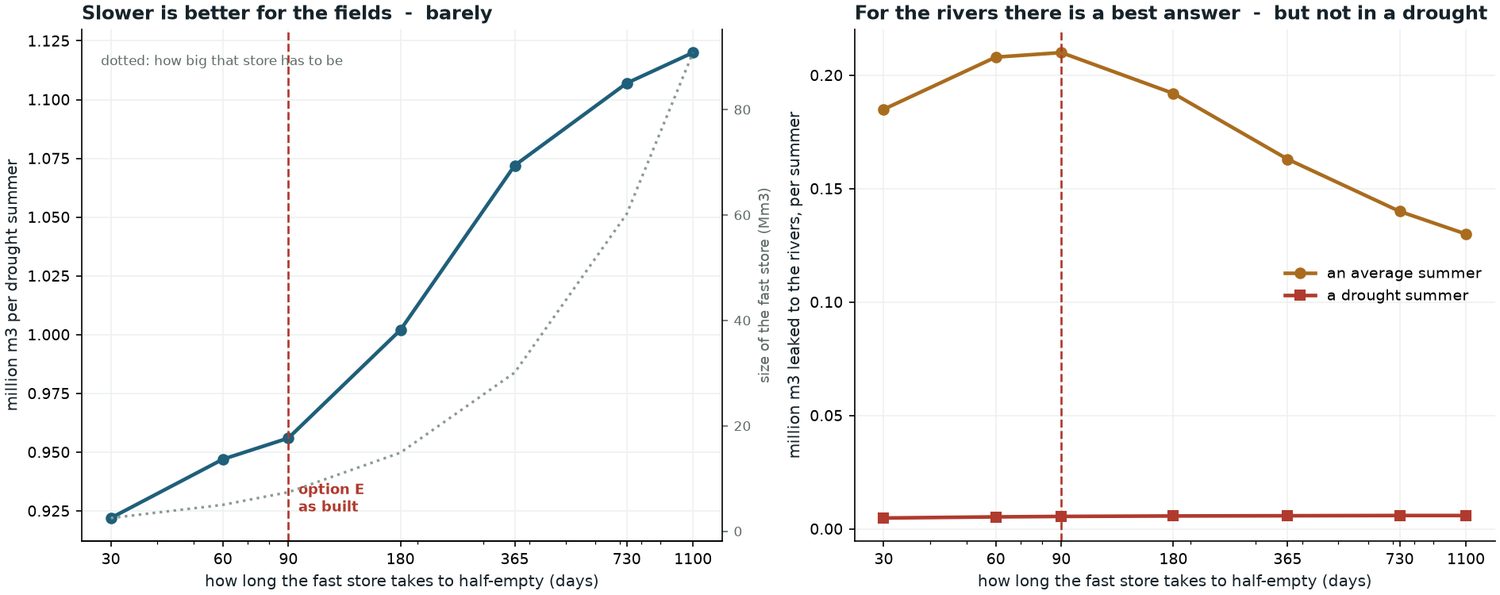
Slower is better for the fields, and the gain is almost nothing. Across the sweep delivery rises from 0.92 to 1.12 million m³ a drought summer — 21% — while the store it needs grows from 2.5 to 91 million m³, a well field 12 km across holding more than most winters produce. Multiply the storage by thirty-six, gain a fifth.
For the rivers there is a real optimum — about 90 days, near enough what the option already uses, feeding 0.21 million m³ over an average summer. In a drought summer it is 0.005 to 0.006 million m³, flat across the whole sweep. No half-life rescues it.
Two further refinements were tried and are kept in the model, off by default: crediting the leak against the day’s river-support release, and holding the fast-to-slow transfer back until the river is too low to abstract from. The first changes almost nothing, because deliberate releases are only 0.02 million m³/yr to begin with. The second moves real water — river baseflow over the record rises from 8.2 to 13.6 million m³, at about 2% of delivery — but not into a drought summer.
F · A basin filled by gravity
| Component | Specification |
|---|---|
| Reservoir | 5 million m³ in a natural hollow, ~3 km², under 2 m deep |
| Filling | gravity through a sluice — no intake pump |
| Aquifer | 2 km well field, ~16 Mm³ |
| Injection | 80,000 m³/day |
| Recovery | 40,000 m³/day |
| Pipework | 1.5 km river to basin; 2.3 km basin to well field; return channel to a lower point on the same river |
**5.67 million m³ per drought summer** — enough to cover **89%** of drought-summer days with a survival ration. The same scheme as C, but the basin sits low enough that the river fills it through a gate when in flood — no intake pump at all. **The best performer of the eight.**
G · An existing flood storage moor
| Component | Specification |
|---|---|
| Reservoir | 3 million m³ held on a moor already used for flood storage — ~10 km² at 0.3 m |
| Filling | gravity through the existing inlets |
| Aquifer | 2 km well field, ~16 Mm³ |
| Injection | 80,000 m³/day |
| Recovery | 40,000 m³/day |
| Pipework | inlets and pumping station already exist; new pipe is 1.6 km basin to well field |
**4.67 million m³ per drought summer** — enough to cover **74%** of drought-summer days with a survival ration. The same idea as F, on ground that is already flooded every winter on purpose. Curry Moor and its neighbours are filled from the river through existing inlets and emptied by an existing pumping station; this option adds injection plant and keeps some of that water instead of pumping all of it away.
H · The best rock nobody has tested
| Component | Specification |
|---|---|
| Reservoir | 5 million m³ — identical to C |
| Aquifer | Upper Greensand, 2 km well field, 18.8 Mm³, 6.3-year half-life |
| Intake | 150,000 m³/day — identical to C |
| Injection | 150,000 m³/day — identical to C |
| Recovery | 40,000 m³/day — identical to C |
| Pipework | 3.5 km river to basin; 12.5 km basin to well field |
| Confidence | properties estimated from rock type, never measured |
**2.40 million m³ per drought summer** — enough to cover **39%** of drought-summer days with a survival ration. Option C moved onto different ground, and nothing else changed. The Greensand is estimated to hold half again as much water as the sandstone and to keep it half again as long — so this is what better rock is worth, with every other dial held still.
Better rock is worth about a fifth. C delivers 1.96 million m³ a drought summer; H, with 20% more storage held 45% longer, delivers 2.40 — a gain of 23%. Real, and worth having. But the options that reach across the landscape deliver two and a half times C, on the same rock.
So the ranking does not turn on finding better ground. It turns on how much water a scheme can catch. That is worth knowing before anyone spends money looking for a better aquifer.
Every number in this option, and in E, rests on a transmissivity and a specific yield inferred from rock type and flagged “guess” in the source data. No leakage has ever been measured on the Greensand. Treat H as an upper bound on what better rock could buy, not as a result: if the estimate is out by a factor of two, so is the answer.
What the three tests show
The cost of being new is real but not fatal. Maturity is worth between nothing (option A) and about 15% (option F). A scheme commissioned in 2010 would have met little of the 2010–11 drought, simply because it had not yet banked anything.
The mature store buys about one year. Year 1 of the drought test separates the options widely. From year 2 onward each settles into a pattern set by what it can catch from that year’s flows — options A, B, C, E and H all deliver between 0.7 and 2.6 Mm³ regardless of how much storage they hold, and H holds the most of the five.
Nothing collapses. Even in six consecutive drought years the driest years still carry enough water at high flow that a scheme keeps delivering something. These schemes do not run dry; they run small.
All options side by side
One chart, one question: on a day in a drought summer, is there enough water to keep a crop alive?
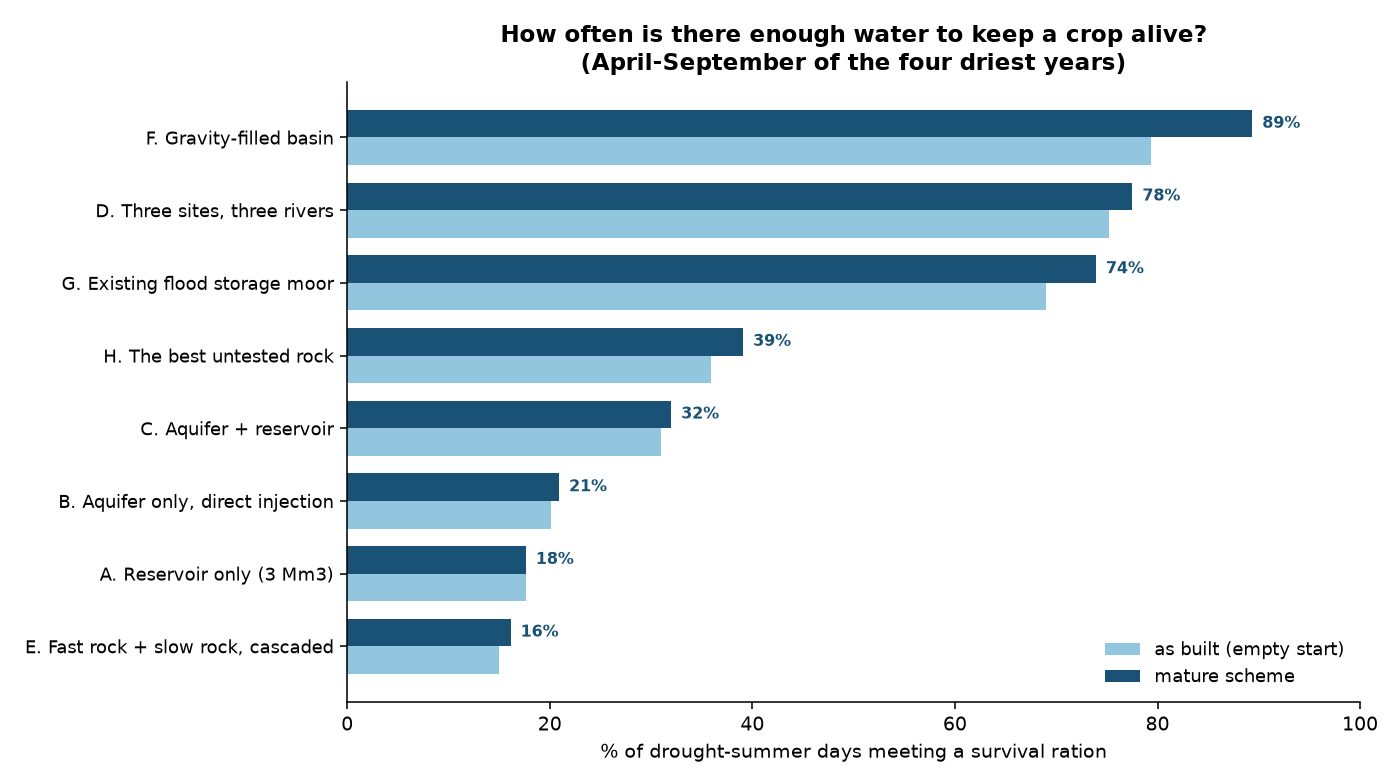
A survival ration here means 2,700 m³/day — roughly a sixth of what is licensed. It is a stated stand-in, not an agronomic finding: there is no crop model here, and the real figure depends on the crop, the soil and the week. Change the threshold and the percentages move; the ordering is what matters.
The chart splits into two clear groups. The five options built on one river cover 16–39% of drought days; the three that reach across the landscape cover 74–89%. Every one is sized at its own best configuration, so the gap is not a sizing artefact.
And the gap survives changing the ground underneath. H is option C on the best rock in the study area, and it reaches 39% — still less than half of what the weakest landscape-scale option manages on ordinary sandstone. The difference is not how much water these schemes store. It is how much they can catch.
The rhythm of each option
A single number per drought summer cannot show when a scheme hands water over, and that turns out to be most of the difference between them. The next two charts put all eight on the same clock.
Blue is water going out. The red line is water still in store. Grey behind is rainfall. Both charts share one scale and one clock, and every option is running as a mature scheme.
The pink band at the right is not a forecast. It is the record’s own first three years replayed as if they were the next three, starting the day after the record ends and lined up so the seasons still fall where they should. Each option carries straight on from wherever August 2026 leaves its stores — so the band answers the question a table cannot: if the next three years were like 2010–13, what would this option do?
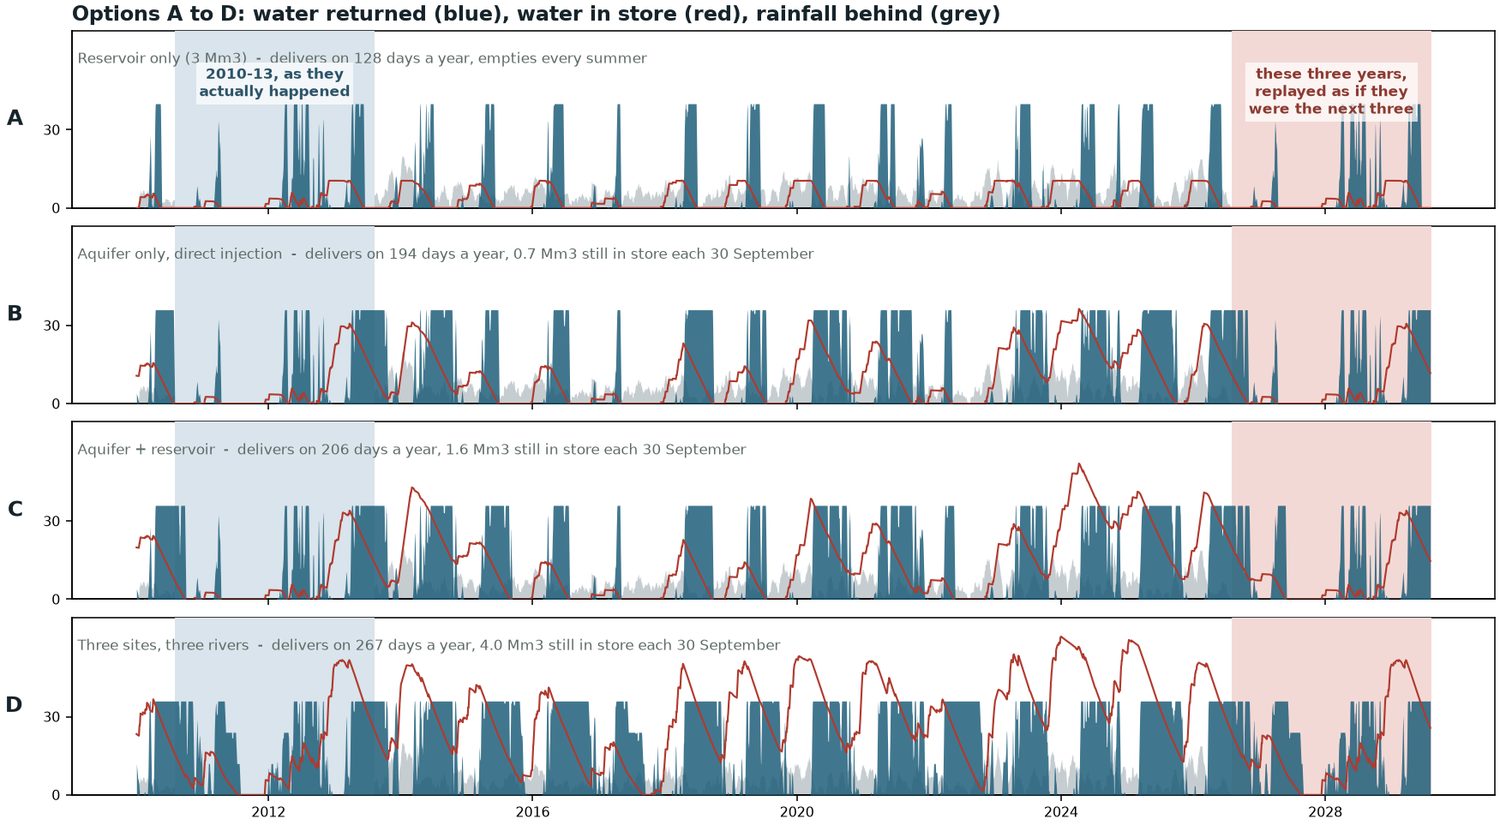
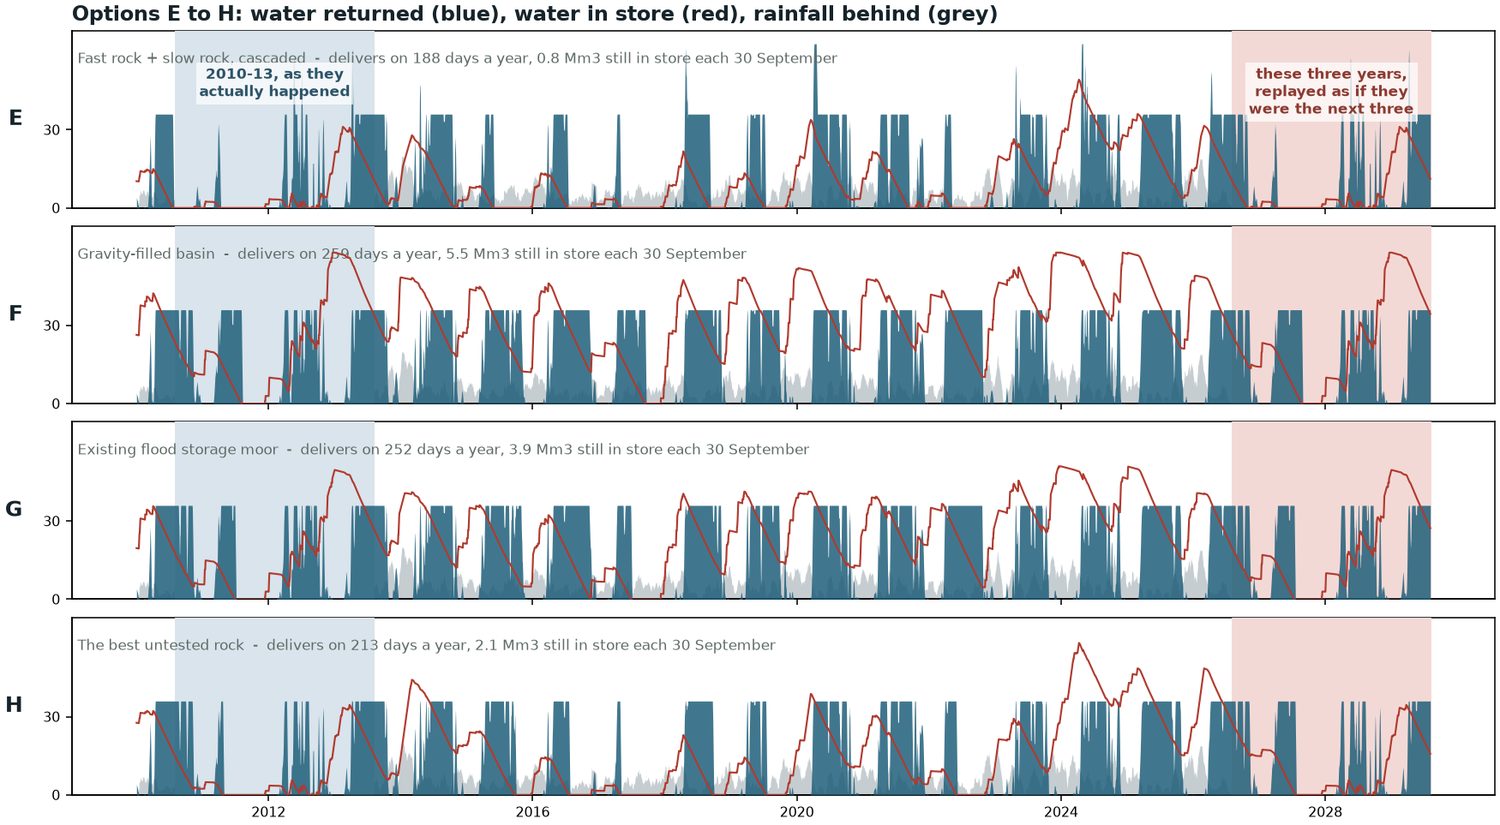
Every option pushes water out at the same rate — the recovery pump is the ceiling and all of them reach it. What separates them is how many days a year they can push at all: 128 days for A, 259 for F. Not how hard, but how often.
The red lines say why. A’s returns to zero every summer and starts each winter from nothing — it has no memory, so a bad winter is a bad summer with no appeal. F and G still hold 5.5 and 3.9 million m³ on the 30th of September, which is next year’s opening balance.
Over those three replayed years, A delivers 8.4 million m³ and F delivers 19.5 — on 139 and 253 days a year respectively. The three years include the driest in the record, and the options that arrive at 2026 with water already banked are the ones that get through them.
The same thing shows in how steady each option is from year to year. A’s best year delivers 5 times its worst; F’s ratio is 1.5. That is what “smoothing” means in practice — not a gentler daily curve, but a smaller gap between a good year and a bad one.
What a scheme looks like from the inside
One option in detail, to show the mechanism the table hides. This is C, the conventional basin-plus-wells scheme, over eight years.
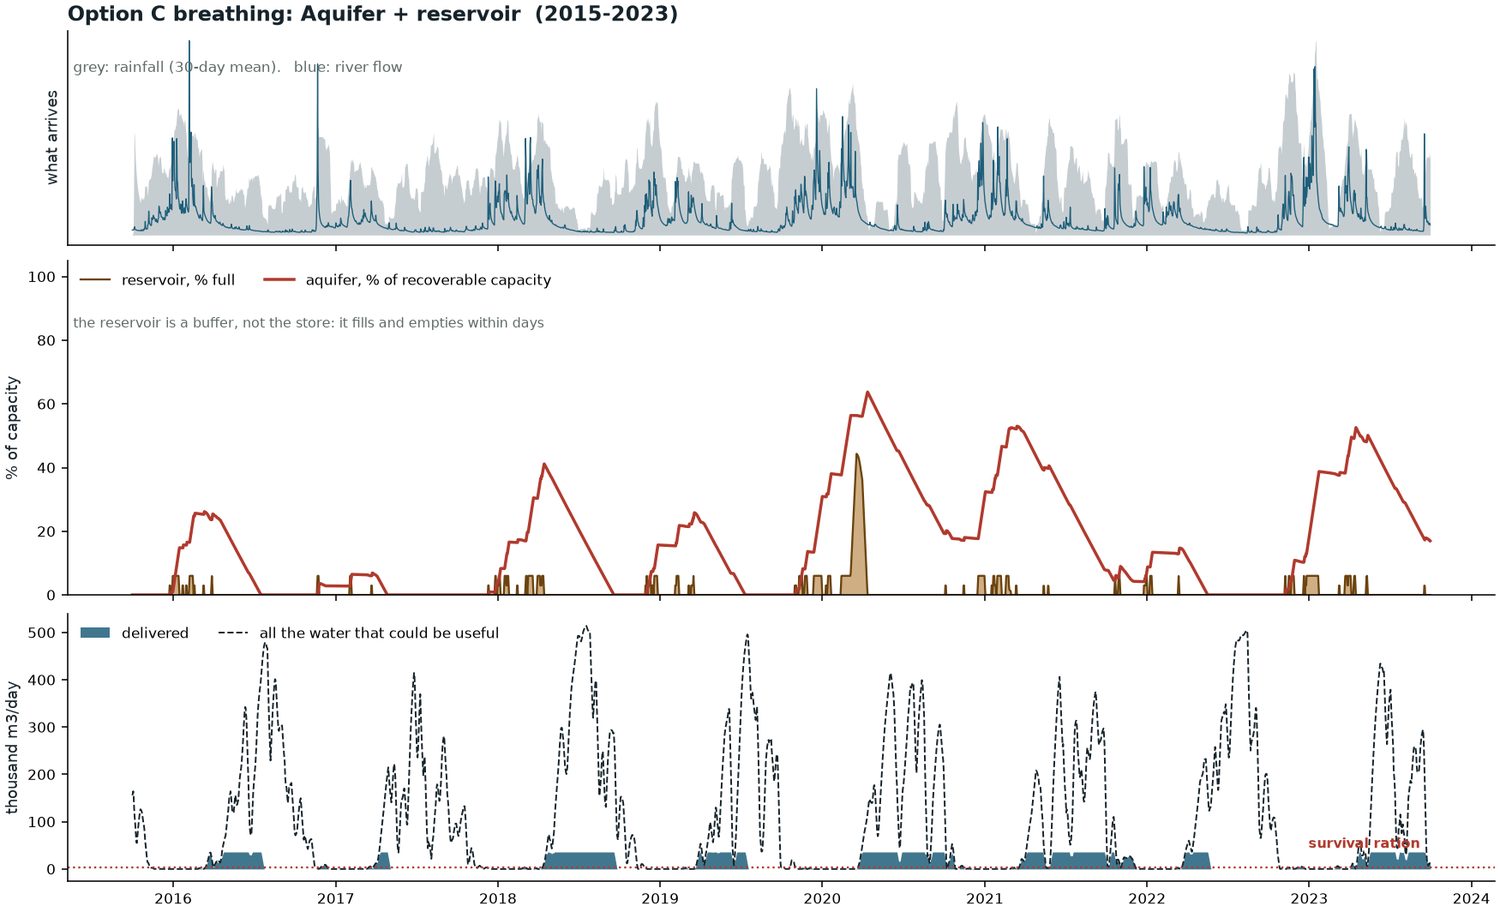
The basin is a buffer, not the store. Its job is to hold a two-day flood long enough to push it down the wells over the following weeks. Almost none of the water a scheme delivers in August was in the basin in July — it was underground. That is why the reservoir-only option behaves so differently, and why the size of the basin stops mattering above a few million m³.
The same view of the two options that reach across the landscape shows why each of them works, and what each has to respect.
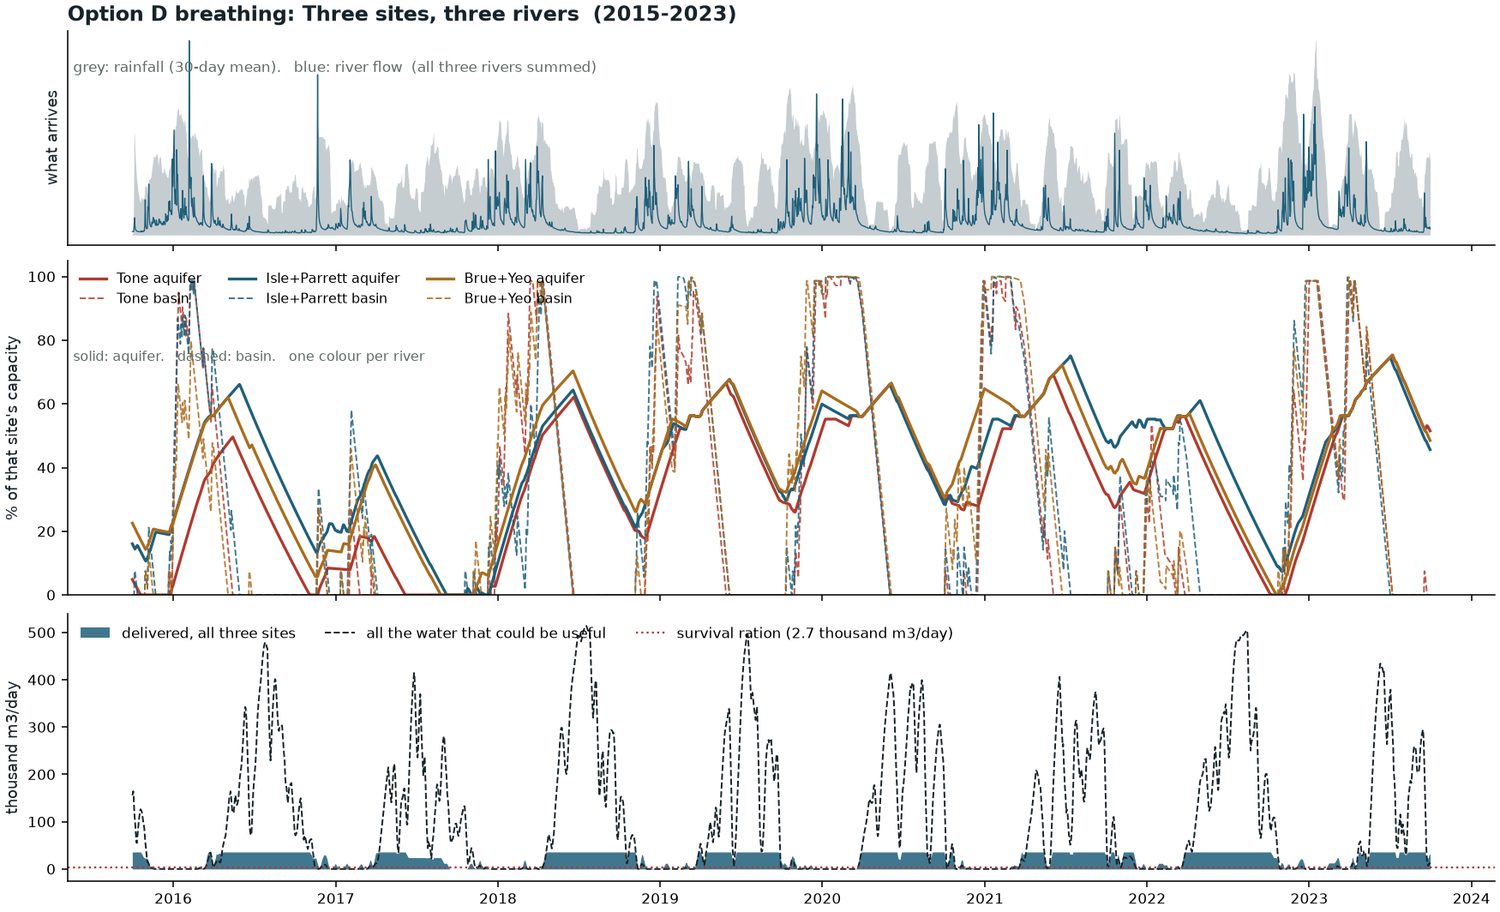
Option G has a constraint none of the others do: the moor it would use is not empty ground. It is held to water levels agreed between the Drainage Board, the Environment Agency and Natural England, for farming and for birds.
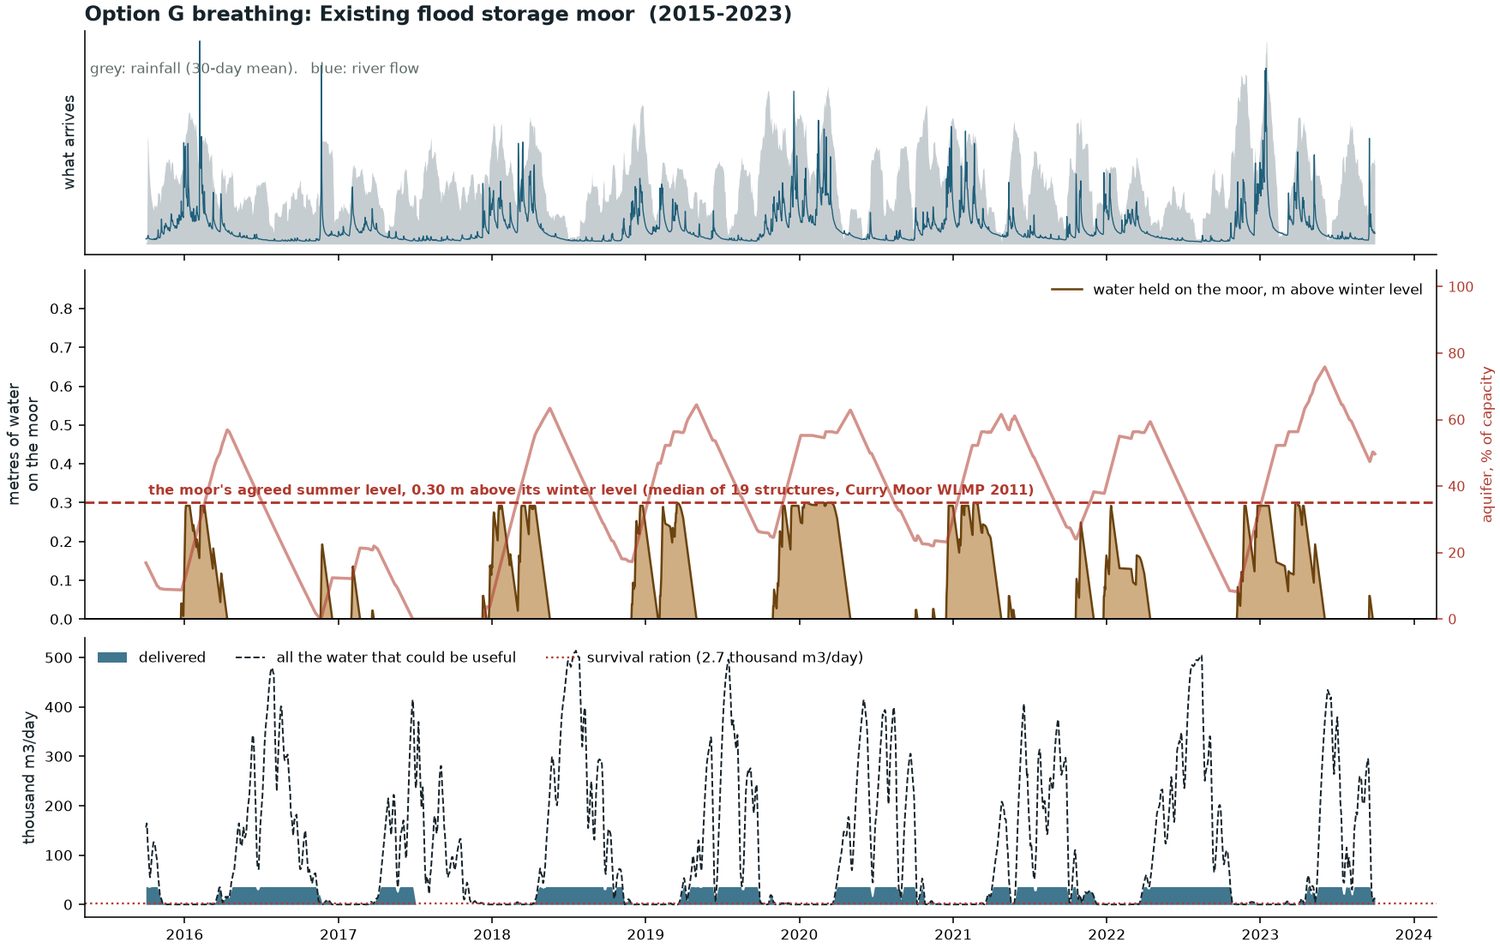
The moor never crosses that line. That is by construction, not by discovery: the option was given 3 million m³ over roughly 10 km², which is 0.3 m, before anyone looked at the plan. What the plan adds is that 0.30 m happens to be exactly the band the moor is already managed through — so this option is asking to use depth that is already consented, rather than asking for more.
That is a reason to look at it and not a reason to assume it is free. The plans set levels by season, and a recharge scheme wants water held at times the plan may not allow. Whether the timing works is a conversation with the Board and Natural England, not a modelling result.
What is worth exploring, and why it works
⭐ Let the river fill the basin itself
What it is. A basin sitting low enough that when the river runs high it simply flows in through a gate. No pump. When the flood passes the water drains back to the river, or is pumped underground at leisure.
Why it works. The water arrives in nine bursts a year, two days each. To catch a whole burst by pumping you would need a machine moving 560,000 m³ a day — used nine days a year. A gate costs almost nothing to run and has no such limit.
What would stop it. The ground has to be in the right place: below the river when it floods, above it when it does not. The screen found candidates, but the estimate of flood level behind them is the weakest number in the study.
⭐ Use the moors that already flood
What it is. Several moors are already flooded deliberately in winter to protect towns, with inlets and pumping stations built and operating. Also use that water — put some underground before the moor is drained.
Why it works. Most of the cost is already spent. The structures exist, the operating practice exists, and the moors already fill and empty on roughly the right rhythm.
What would stop it. Those moors are managed to agreed levels for farming and for birds, and those agreements would have to be reopened. It needs the Drainage Board and Natural England, not just an engineer.
⭐ Spread across several rivers
What it is. Three modest schemes on three different rivers instead of one large one.
Why it works. The rivers do not flood on the same days. Three modest intakes are busy more often than one large one, so they catch about 10% more water for the same total pumping.
What would stop it. Three sites means three lots of land, consent, access and maintenance. The water case is good; the cost case is untested.
Worth knowing about, but not the answer
A reservoir on its own
Water straight down wells, no basin
A fast-draining store feeding the rivers
What this study does not say
- It does not recommend a scheme. Costs would decide between these options and none has been estimated.
- It does not claim a return period. The six-year drought is a stress test built from real years in an invented order.
- It does not predict what the rock will accept. No injection has ever been made here.
- Land ownership, designations and consents are unchecked for every candidate site.
- Clogging — the most common way such schemes fail in practice — is not modelled at all.
- The survival threshold is this study’s own, not an agronomist’s.
What the next steps would be
- Survey river levels at the candidate basins. Cheap, quick, and it decides whether the best-performing option is real.
- Talk to the Drainage Board about the flood-storage moors. If they can double as recharge basins, most of the capital is spent.
- Cost the options. Wells against earthworks is the trade that decides this.
- Do one injection test. It would remove the largest single uncertainty in the study.
Somerset Levels & Vale of Taunton feasibility study, version 2 · 13 August 2026. Sources: Environment Agency hydrology and abstraction data; British Geological Survey mapping and report WD/97/34; Defra Crop Map of England 2024; Somerset Drainage Boards Consortium Water Level Management Plans; OpenStreetMap contributors. Every figure is reproducible from raw data with a single command.
Where every number comes from
Every figure above is produced by a background chapter, and every chapter regenerates from raw Environment Agency, BGS and Defra data with one command. They are working documents rather than prose, and they sit behind this report rather than beside it.
- The background chapters — all forty-one, grouped by layer: the water, the rock, the demand and the scheme.
- Earlier versions — the drafts this report grew out of, and the corrections between them.