The water table
Generated by build_water_table.py. Fitted so that saturated thickness stops being the full thickness of the rock.
Generated by build_water_table.py. Fitted so that saturated thickness stops being the full thickness of the rock.
The model
The water table is a subdued replica of topography - it rises under hills and falls under valleys, with less relief than the ground. So water-table elevation is fitted against ground elevation:
wt_elevation = 0.05 + 0.768 x ground_elevation
n = 100 stations   R2 = 0.83   residual SD = 21.1 m
b = 0.768 is the subdued-replica coefficient and it is FITTED, not assumed. b = 1 would mean the water table simply parallels the ground with no unsaturated zone; b = 0 would mean a flat table under varied topography. The fitted value implies roughly 23 m of unsaturated rock for every 100 m of ground elevation.
This is a regional relation, not a groundwater model. No pumping, no recharge, no anisotropy, no time. What it buys is the right first-order correction - tens of metres of dry rock under hills - in place of the previous assumption of none. The residual SD is carried into the volume range, so a loose fit WIDENS the answer rather than quietly sharpening it.
Both sides of the regression come from the same record: EA station datum is ground level in mAOD and the level series is water level in mAOD, so depth to water is datum - level and needs no elevation model to calibrate. The DEM is used only to carry the fitted relation onto bodies that have no station in them.
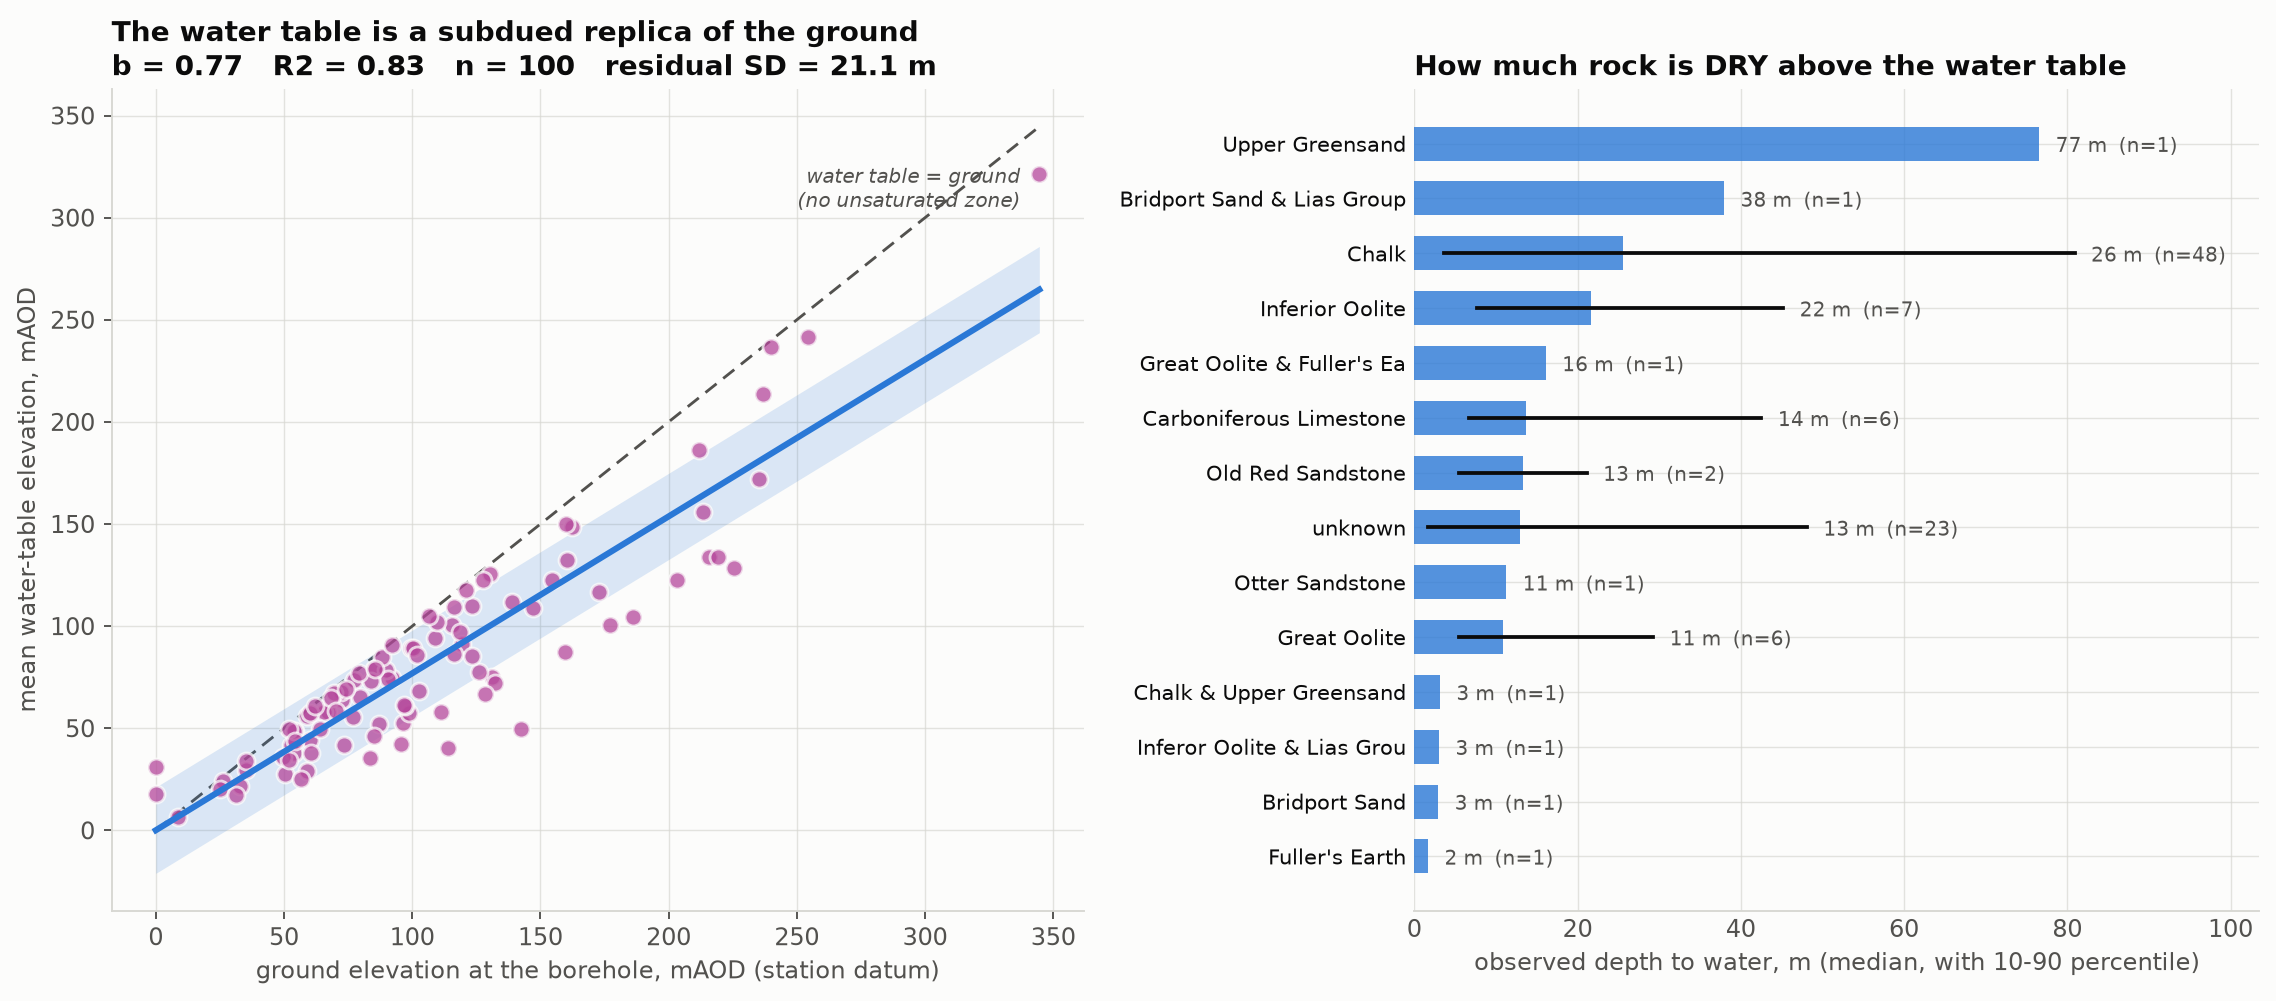
Depth to water by aquifer, as OBSERVED
| aquifer | stations | median depth m | 10-90 percentile |
|---|---|---|---|
| Chalk | 48 | 25.6 | 3.7 - 80.9 |
| unknown | 23 | 12.9 | 1.7 - 48.1 |
| Inferior Oolite | 7 | 21.6 | 7.6 - 45.2 |
| Great Oolite | 6 | 10.9 | 5.4 - 29.3 |
| Carboniferous Limestone | 6 | 13.6 | 6.7 - 42.5 |
| Old Red Sandstone | 2 | 13.3 | 5.4 - 21.1 |
| Fuller’s Earth | 1 | 1.7 | 1.7 - 1.7 |
| Chalk & Upper Greensand | 1 | 3.1 | 3.1 - 3.1 |
| Bridport Sand | 1 | 2.9 | 2.9 - 2.9 |
| Bridport Sand & Lias Group | 1 | 37.9 | 37.9 - 37.9 |
| Inferor Oolite & Lias Group & Old Red Sandstone | 1 | 3.0 | 3.0 - 3.0 |
| Great Oolite & Fuller’s Earth | 1 | 16.1 | 16.1 - 16.1 |
| Otter Sandstone | 1 | 11.3 | 11.3 - 11.3 |
| Upper Greensand | 1 | 76.6 | 76.6 - 76.6 |
Aquifers with fewer than 8 stations cannot earn their own fit and take the all-station relation. A borrowed relation is a different claim from a fitted one, and fit_used records which each body got.
What this does to the volumes
Mean predicted depth to water across the 335 bodies is 27.6 m (range 0.0 - 86.0 m). Every metre of that is rock that build_aquifer_volumes.py was counting as saturated and is not.