A demand series with a rhythm
Generated by build_demand_series.py. Shape from physics, level from the licence.
Generated by build_demand_series.py. Shape from physics, level from the licence.
The scheme runs used a flat 3,000,000 m3/yr on a fixed monthly curve. Chapter 2 bounded the level; this gives it a shape, and the shape carries the property that matters most.
Not from abstraction returns, and why that is fine
The obvious source is what was actually taken, month by month. It is not published. The EA releases returns only as a six-year average volume and a percentage of authorised quantity, inside the Water Rights Trading spreadsheet; there is no monthly series. A request to water_abstractiondigital@environment-agency.gov.uk is the route to one.
That matters less than it first appears, because returns would have been a poor source for shape anyway. In a drought what was taken is what was available, so returns carry the shortage in their shape as well as in their level - the same objection the layer README makes to using them as a level.
Where the shape comes from
The water layer already computed the right signal and nobody had used it. build_runoff_model.run() returns actual evapotranspiration; pet_series() gives potential. The difference is the water the crop wanted and did not get:
deficit(t) = PET(t) - AET(t) mm/day
That is an irrigation requirement from first principles, on a model already fitted to river flow at nine catchments. Three properties the fixed curve did not have:
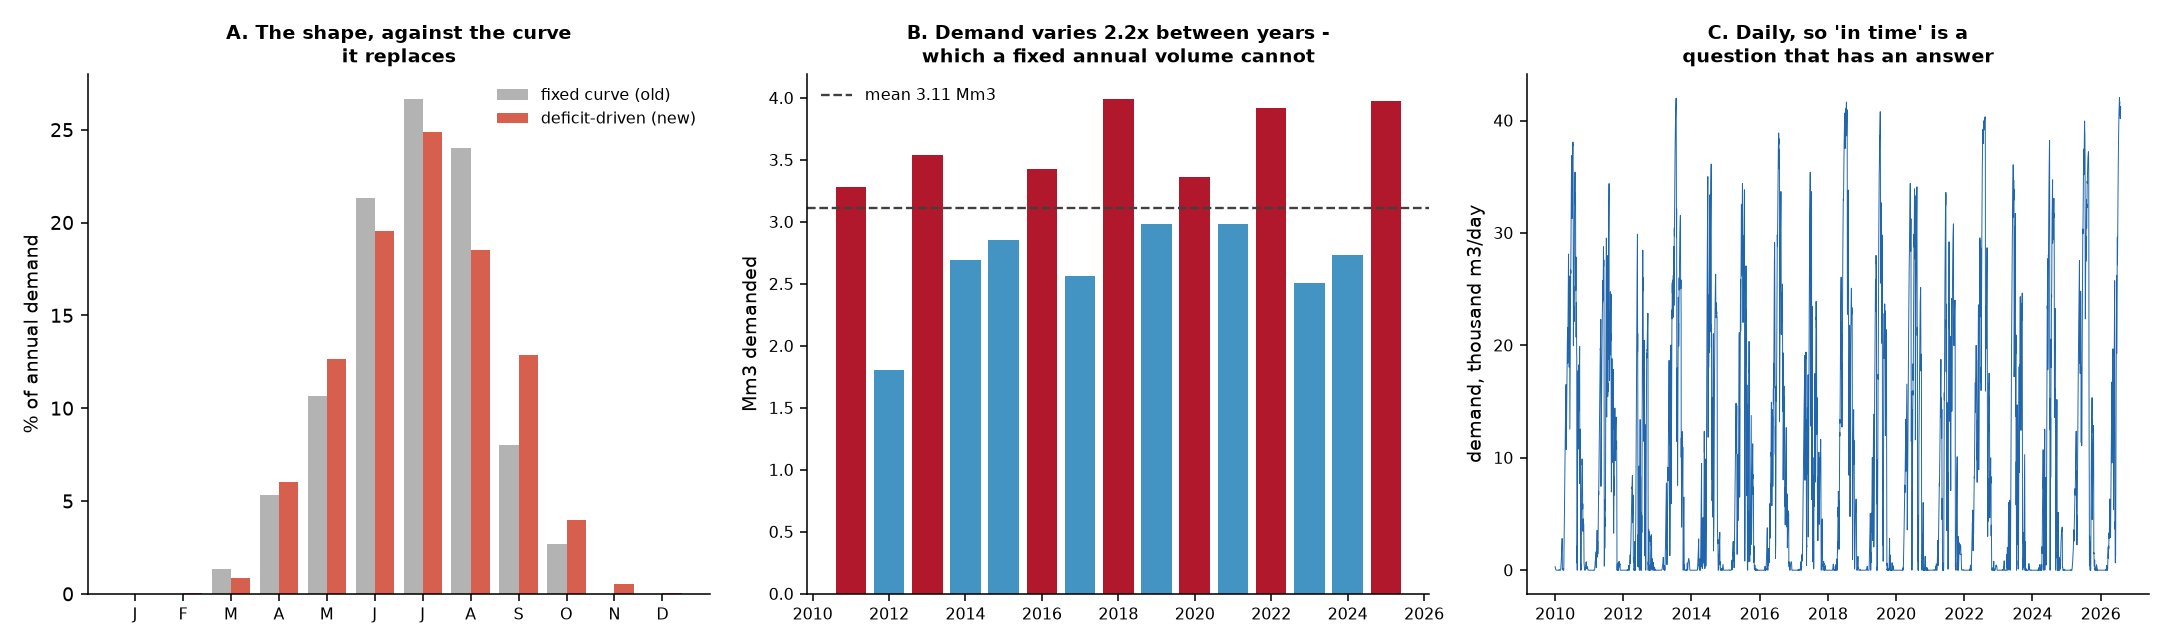
- The right phase. 63% of demand falls in June-August, against 0% in December-February.
- Year-to-year variation, in the right direction. This is the important one - see below.
- Daily resolution, so did the water arrive in time is a question with an answer.
The property that matters
Annual demand ranges 1.81 to 3.99 Mm3 across 15 full years, a 2.2x spread, against a mean of 3.11.
Does demand peak when supply fails? Weakly, and the measurement is worth more than the intuition. Against the divertible resource per water year from the availability chapter:
- Pearson r = -0.16, Spearman -0.15, n = 15
The sign is right - dry years do tend to want more water - but the relationship is too weak to claim as a finding, and the record contradicts it in places: WY2017 and WY2022 were both severe supply droughts, and demand was near its minimum in one and near its maximum in the other. Summer rainfall and winter rainfall are not the same thing, and it is winter that fills the reservoirs.
So the case for a varying demand is not that the correlation is strong. It is that a constant forces the correlation to be exactly zero, and guarantees the scheme meets its hardest supply year with an average demand year. That is a modelling artefact, and removing it is worth doing even when the true relationship turns out to be modest.
| year | Mm3 demanded | vs mean |
|---|---|---|
| 2011 | 3.28 | 105% |
| 2012 | 1.81 | 58% |
| 2013 | 3.54 | 114% |
| 2014 | 2.70 | 87% |
| 2015 | 2.85 | 92% |
| 2016 | 3.43 | 110% |
| 2017 | 2.56 | 82% |
| 2018 | 3.99 | 128% |
| 2019 | 2.99 | 96% |
| 2020 | 3.36 | 108% |
| 2021 | 2.99 | 96% |
| 2022 | 3.92 | 126% |
| 2023 | 2.51 | 81% |
| 2024 | 2.74 | 88% |
| 2025 | 3.98 | 128% |
The level, and the cap
The series is scaled so its long-run mean is 3.19 Mm3/yr - the irrigation + general farming figure from chapter 2.
The upper of the two licensed figures is the default, deliberately. Understating demand makes a drought scheme look better than it is, so the safe direction here is the opposite of the safe direction for supply.
Peak days are capped at 94,227 m3/day, scaled from the licensed daily maxima in the 100 km2 window (7,668 m3/day against 0.260 Mm3/yr licensed there). No day reached the cap.
The hole, and it runs in the dangerous direction
Areal rainfall begins 2012-01-01, so this series does too (2010-01-01 to 2026-08-04). The drought this study cares most about is 2010-11.
Any run starting in 2010 must fall back to the monthly climatology for those two years, which represents them at average severity when they were almost certainly a demand peak. That understates demand in the worst drought in the record, and understating demand flatters the scheme. It is the one error here that runs the dangerous way.
Fixing it needs rainfall before 2012, which the gauges may hold even though the areal series does not.
Useful water, and why the licence is not the ceiling
The series above is scaled to the licensed figure, which answers how much may be taken. It does not answer how much would do good - and for appraising a scheme that CREATES water, the second question is the relevant one. A licence is a policy instrument that can be varied, and a new resource normally comes with a new determination.
So here is the physical picture. Mean annual soil-moisture deficit over the study area is 303 mm. The water needed to close it, by area:
| tier | area km2 | Mm3/yr | vs licensed |
|---|---|---|---|
| licensed today | — | 3.19 | 1.0x |
| full deficit on arable | 323 | 97.9 | 31x |
| full deficit on grass | 721 | 218.1 | 68x |
| full deficit on fallow | 11 | 3.2 | 1x |
| full deficit on all agricultural | 1,055 | 319.2 | 100x |
The licensed volume is 1.0% of the water that could physically do good on this land. Even confined to arable, it is 3.3%.
Demand is not the binding constraint on this scheme, and it never will be. The whole divertible resource is 148 Mm3/yr (availability) - 47% of the full agricultural deficit, and far less than that once storage and carry-over losses are applied. The scheme’s size is set by what it can capture and hold, not by what anyone needs. Sizing against a demand figure - licensed or otherwise - measures the wrong constraint.
What these tiers are not
- Useful is not economic. Closing the deficit on 721 km2 of grazing marsh would grow more grass; almost none of it would pay for the pipe. These tiers bound the problem and say where the constraint lies; the economics belong to the costing stage.
- The interesting tier is missing. The water needed to avoid crop failure - as opposed to reaching full yield - is the one a drought scheme is really for, and it is far smaller than full deficit. It needs crop coefficients and a yield-response function, neither of which this project has, so it is named and left empty rather than guessed.
- Full deficit is an upper bound on benefit, not a target. Real irrigation is applied in discrete events to a threshold, not continuously to zero deficit.
How to model above the licence
build_demand_series.py --annual-mm3 N sets the level to any figure, so a scenario can be run against a demand well above the licensed ceiling without editing anything. The licence is a default, not a constraint built into the model.
What this still is not
- Not a crop model.
PET - AETis a soil-water deficit, not an irrigation schedule. Real irrigation is triggered by crop-specific thresholds, applied in discrete events, and stops at harvest. The shape is right; the mechanism is a proxy. - Not spatial. One series for the study area, the mean of nine catchments. Weighting by agricultural area is a refinement.
- Still anchored to a licensed ceiling, with all of chapter 2’s caveats - nine licences, one window, permission rather than need.