Mapping the opportunity — how it was built
Method, reliability and findings behind the southern England screen
Method, reliability and findings behind the southern England screen
Technical companion note | August 2026
This note explains how the southern England screen was produced, how far each step can be trusted, and what the resulting numbers do and do not mean. It is written to be argued with: every judgement is named, every weakness stated, and every figure traceable to an open dataset.
1. The data
Everything used is open, and everything is vector or tabular - there is deliberately no terrain data and no satellite imagery, so the whole analysis runs on an ordinary laptop from about 130 MB of downloads. The study area is Somerset to Kent, the south coast to roughly the Thames: 365 by 140 kilometres.
| Dataset | What it gives us | In our area | Source |
|---|---|---|---|
| EA Hydrology API | Daily mean river flow, 2015-2025 | 374 stations, 1.47M readings | Environment Agency |
| BGS 1:625k Hydrogeology | Which rock is where, and how productive | 2,485 polygons | BGS / UKRI |
| WFD Groundwater Bodies | Regulatory units and their health status | 123 bodies | Environment Agency |
| OS Open Rivers | The river network, and which way it flows | 24,714 links | Ordnance Survey |
| BGS GeoIndex boreholes | Where holes were drilled, and how deep | 248,516 records | BGS / UKRI |
| Source Protection Zones | Groundwater protected for public supply | 1,789 zones | Environment Agency |
| SSSI / SAC / SPA / Ramsar | Protected wildlife sites | 2,943 sites | Natural England |
| CaBA Chalk Streams | Designated chalk stream reaches | 6,372 reaches | The Rivers Trust |
2. Turning flow records into a ‘divertible volume’
This step produces the headline number, so it deserves the most scrutiny.
The idea. You cannot take water from a river whenever you like. An abstraction licence typically says: don’t start pumping until the river runs high, and never draw it below a floor. We applied that shape of rule to every gauge. The trigger is the flow the river exceeds 12.5% of the time - a high flow, below which pumps stay off. The hands-off level is the flow it exceeds 19% of the time, and the river is never drawn below it. On a day above the trigger, the divertible volume is whatever sits between the two, multiplied by the seconds in a day.
Both thresholds come from each station’s own record, so a small Sussex stream is judged against its own behaviour rather than a regional average. Totals run over water years (October to September) so a winter is never split across two annual figures, and a year counts only if at least 95% complete.
How reliable is it?
Three checks, done rather than assumed. The Thames at Kingston was recalculated from the raw data by separate code sharing nothing with the main pipeline: 431.48 Mm3/yr both ways. The arithmetic reproduces its own definition - days when diversion is allowed should be exactly 12.5% of the record, and across 370 stations the measured figure is 12.43%. And the ‘winter surplus’ claim was tested rather than asserted: the rule contains no season, so nothing forced the answer, yet 92% of divertible volume falls between October and March, and no candidate falls below 88%.
A real problem we found, and fixed
The Environment Agency publishes three daily flow series per station - mean, minimum and maximum - and the field identifying which is which is missing from the API’s search results. Our first run silently pulled the daily minimum for 123 stations and the maximum for 134; only 117 of 374 were correct. The statistic turned out to be recoverable from the series identifier, so it was fixed and everything re-fetched. Anyone reusing that API is exposed to the same trap, and it would not announce itself.
How this step could be improved
A drought sensitivity would help most: a ten-year mean hides how far the resource falls in a dry year, which is exactly when stored water is wanted. The two thresholds are inherited from the Somerset work and undefended in this region - they deserve testing. And many stations reach back to the 1960s, which would let variability be separated from trend.
3. What was actually analysed
Every gauge follows the same sequence. Nothing is weighted and nothing is combined into a single score:
374 flow gauges → 370 with a usable daily-mean record → 83 clearing 20 Mm3/yr → 73 also within 15 km of a suitable aquifer → collapse to 28 independent river systems → ranked by aquifer tier first, volume second.
The aquifer test has two tiers, printed in the output rather than hidden inside a score. Tier 1 is intergranular rock - water moves through the pore spaces between grains, like a sponge, so storage behaves predictably. Here that means Lower Greensand and Triassic sandstone, 1,500 km2 in the study area. Tier 2 is the Chalk, where water moves through cracks: less predictable, but this is the aquifer Britain has actually stored water in, and the North London scheme uses confined Chalk. Tier 1 outranks tier 2 at equal volume.
One exclusion by judgement. The Jurassic oolitic limestones pass the tier-2 test on the official classification and were excluded anyway, because our own Somerset boreholes show them behaving differently: the water table at Mells rises and falls 2.37 m a year, against 6.5 to 13.4 m in three Chalk boreholes. They are still drawn on the map, hatched and labelled as excluded, so the judgement can be challenged rather than disappearing into a filter.
Nesting - the most important step. Flow at one gauge already includes everything upstream of it. Kingston measures the same water as Reading and Windsor, and also the Mole and the Wey, which join the Thames under their own names - so grouping by river name would miss every tributary. Instead the Ordnance Survey river network itself was traced: each link knows its start point, end point and flow direction, which establishes exactly which gauge lies downstream of which. The effect is large. Adding all 73 candidates gives 5,446 Mm3/yr; the 28 genuine systems total 1,943. Nearly two thirds of the naive figure is the same water counted repeatedly.
Three things are reported but never scored: groundwater body status, all constraint layers, and borehole evidence. They change how a row reads, not where it sits. Scoring them would mean asserting regulatory and geological judgements this screen has no basis to make.
4. The map, and how to read it
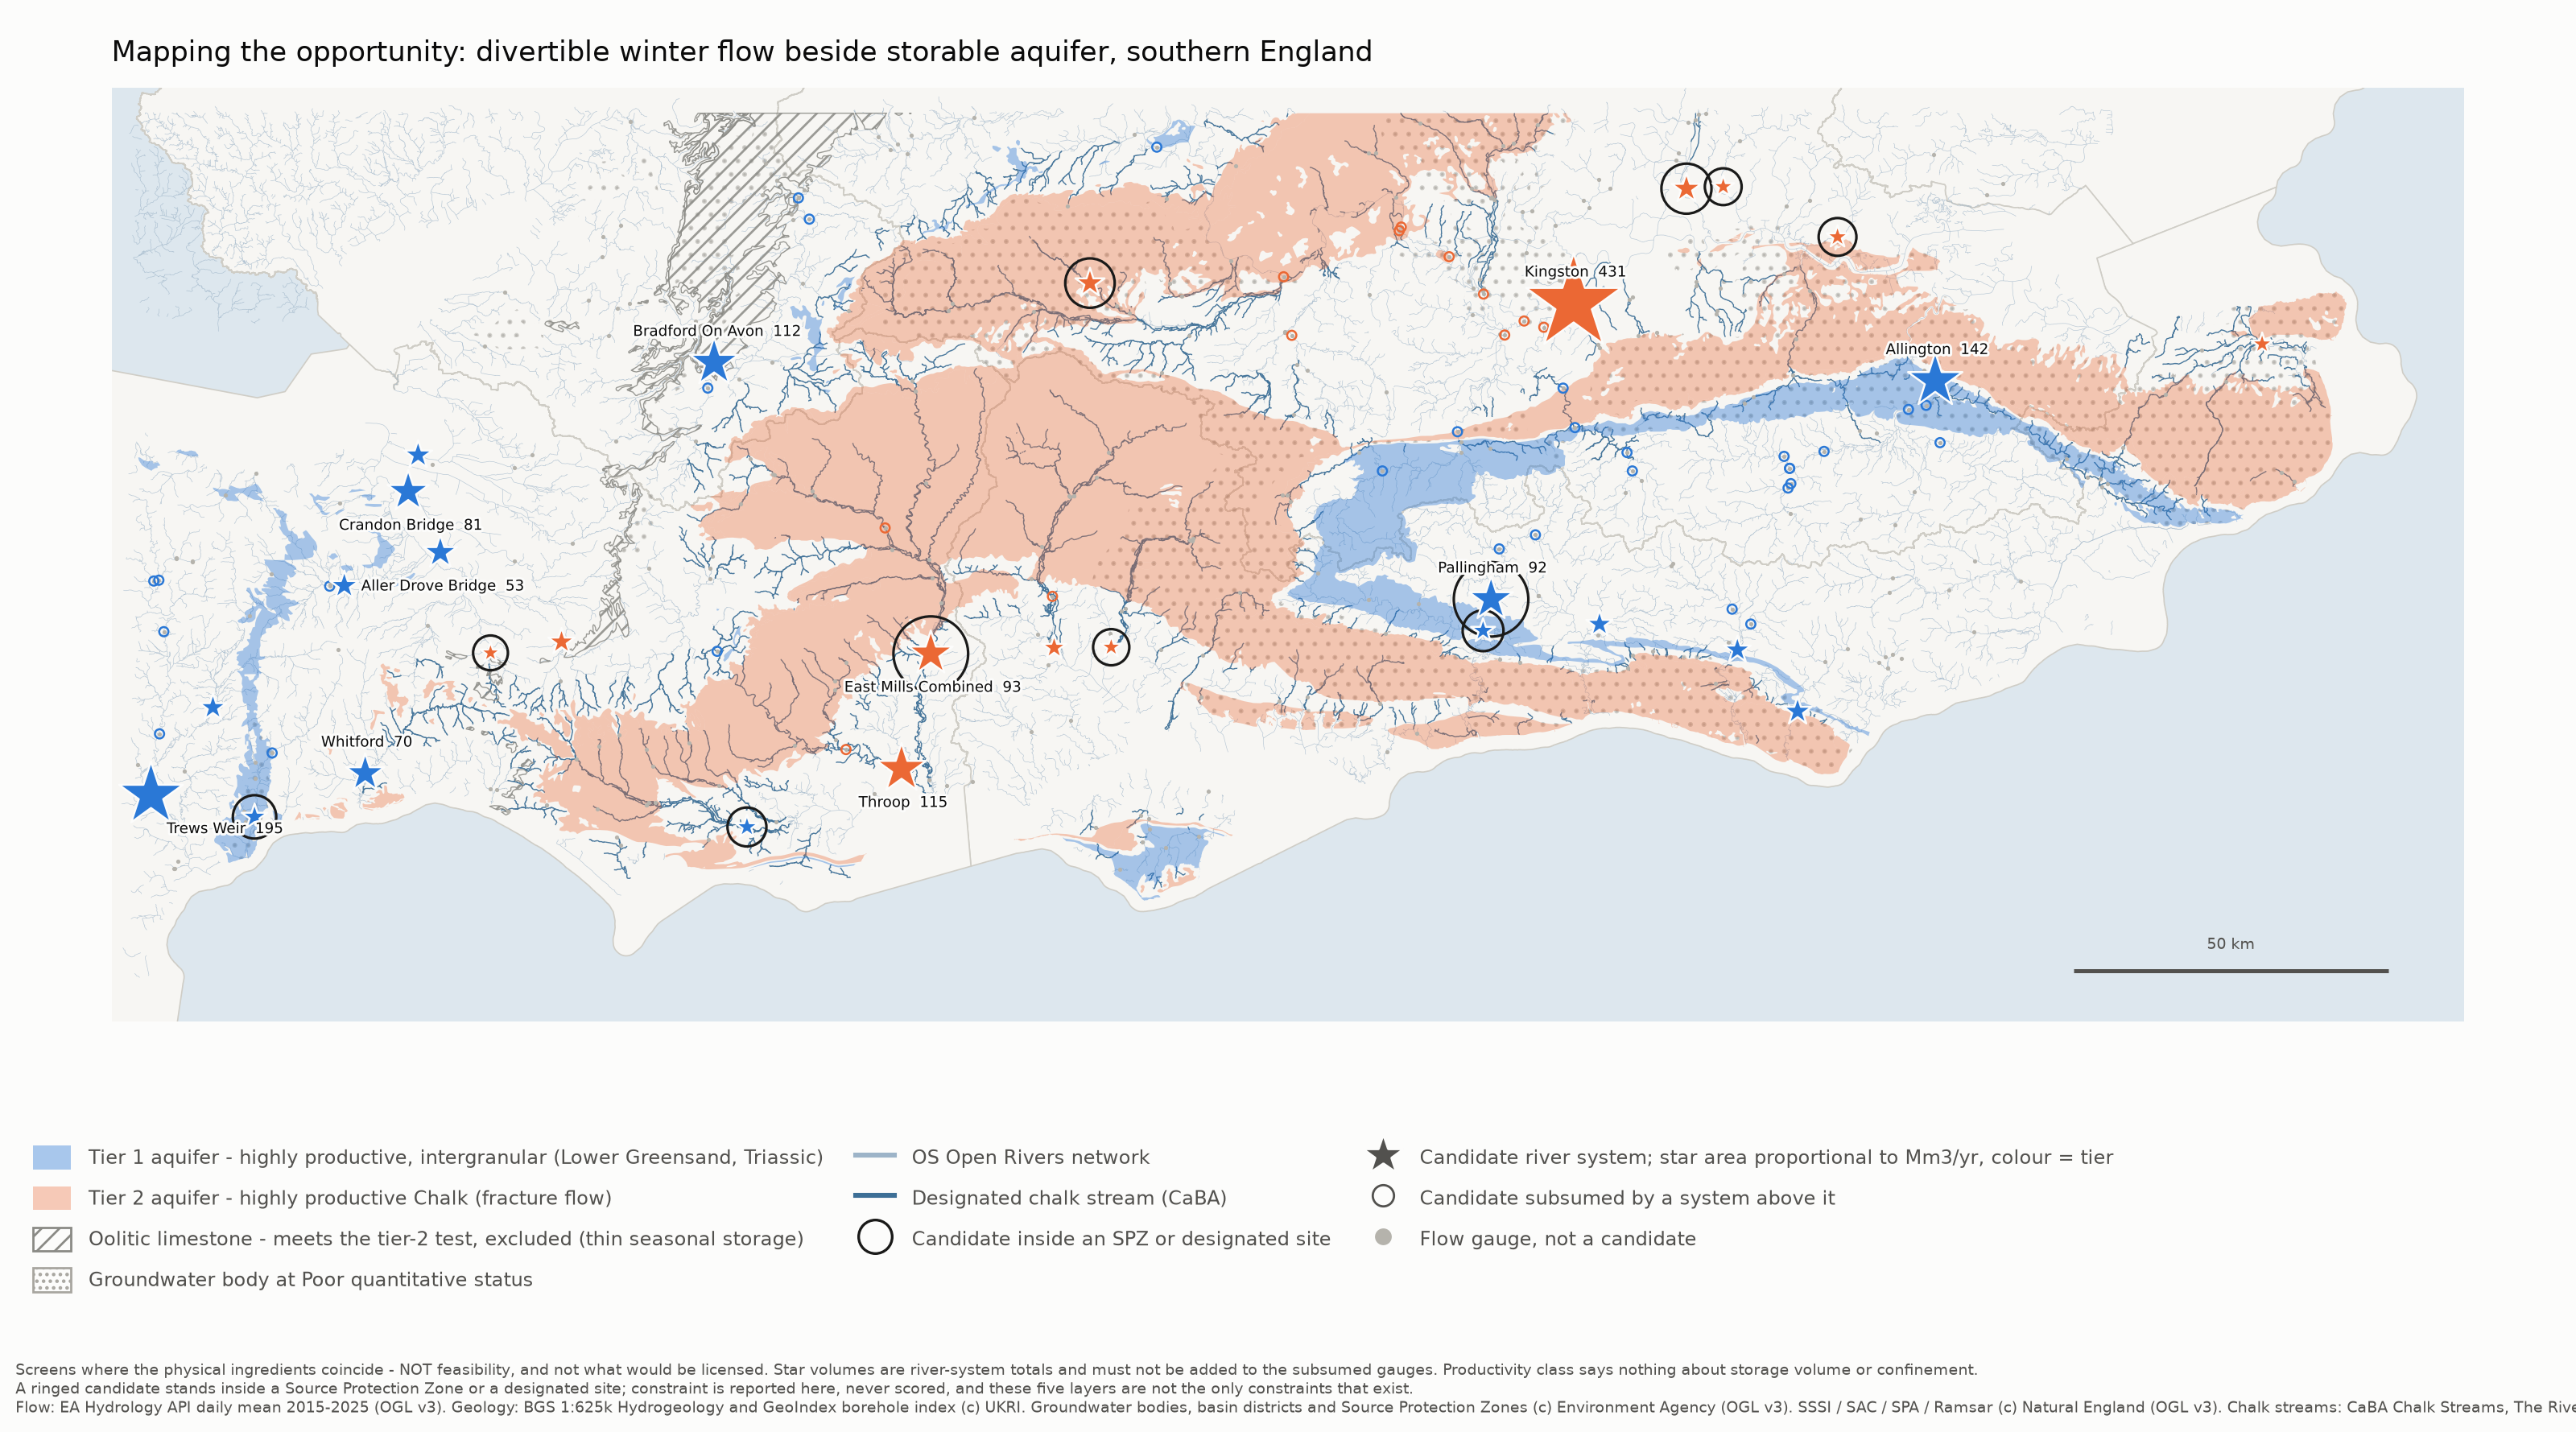
Figure 1. The screen. Full-resolution version supplied separately - the detail rewards zooming.
- Blue and pink areas are the two aquifer tiers - blue intergranular, pink Chalk. Diagonal hatching is the excluded oolitic limestone. Dotted shading marks groundwater bodies already in poor health.
- Stars are candidate river systems. Colour is the tier; area is proportional to divertible volume, so twice the area means twice the water. Only the largest are labelled, to keep the map legible.
- Small open circles are candidates upstream of a star and already counted inside it. Grey dots are the other 297 gauges, which did not qualify.
- A black ring means that candidate stands inside a Source Protection Zone or a designated wildlife site.
- Dark blue lines are designated chalk streams; pale blue is the ordinary river network.
What the map does not say. Nothing about how much water an aquifer could hold, whether it is covered and able to retain water, or whether anyone would be permitted to do any of this. Blank areas are not ‘no opportunity’ - they are places with no gauge, or a gauge that missed a threshold.
5. Findings, and what the numbers mean
Top of each tier; the full 28-row table is in the accompanying technical report.
| tier | system | river | Mm3/yr | subsumes | WFD status | constraint |
|---|---|---|---|---|---|---|
| 1 | Trews Weir | Exe | 194.8 | 4 | Good | none of the five |
| 1 | Allington | Medway | 141.5 | 9 | Poor | SPZ 0.5 km |
| 1 | Bradford on Avon | Bristol Avon | 112.2 | 3 | Poor | SSSI 0.5 km |
| 1 | Pallingham | Arun | 92.2 | 2 | outside | INSIDE SSSI |
| 1 | Crandon Bridge | King’s Sedgemoor Drain | 81.3 | 0 | Good | none of the five |
| 2 | Kingston | Thames | 431.5 | 16 | outside | chalk stream 39 m |
| 2 | Throop | Dorset Stour | 115.5 | 2 | Good | chalk stream 22 m |
| 2 | East Mills Combined | Hampshire Avon | 92.6 | 3 | Good | INSIDE SSSI + SAC |
| 2 | Low Hall | Lee | 41.6 | 0 | outside | INSIDE SPZ1 |
| 2 | Welford | Lambourn | 40.6 | 0 | Poor | INSIDE SPZ3, SSSI + SAC |
What ‘194.8 Mm3/yr’ actually means. Over 2015 to 2025, in an average year, 194.8 million cubic metres passed the gauge at Trews Weir above the hands-off flow, on days when the river was above the trigger. It measures how much water was theoretically available to a licence-shaped rule at that point on that river. It is not an amount anyone could take, store or use.
The traps, spelt out
1Never add two rows together. Each row already contains everything upstream of it. The 28 rows can be compared, but not summed with their own tributary gauges.
2Divertible is not available. No pump, pipeline, treatment plant, borehole or aquifer acceptance rate is considered anywhere in this screen. Whether the ground could swallow water at that rate is untested here - and in most real schemes it is the binding constraint.
3’Highly productive aquifer’ says nothing about storage volume. It describes how easily water moves through rock - and easy movement is as much a reason water will leave a store as a reason it will enter one. What decides whether a winter’s water is still there in August is confinement: a low-permeability cap above it. The 1:625k map cannot show that, because it maps rock at outcrop - where Chalk lies beneath London Clay, the map shows London Clay. Our Somerset measurements give unconfined Chalk a 41-day drainage half-life.
4Distances are straight lines. 15 km on a map is not 15 km of pipeline, and says nothing about the ground in between or who owns it.
5A gauge is a measuring point, not a proposed intake. It is where somebody chose to put a flow recorder, sometimes decades ago.
6Borehole counts are about evidence, not geology. The index carries no rock descriptions, thickness or yield. 808 boreholes near Riverside Park with not one reaching 50 m tells you a lot of shallow construction happened there and nobody drilled for water.
7An empty constraint column means ‘none of these five layers’, not ‘unconstrained’. Licensing, existing users, planning, land ownership and flood risk are all absent.
8’Inside’ is tested at the gauge point. A scheme is bigger than a gauge; four candidates sit within 10 metres of a boundary without counting as inside it.
6. Conclusions
1The resource is real, and concentrated. 28 independent systems clear 20 Mm3/yr, totalling 1,943 Mm3/yr. Kingston alone is 22% of that - one river system is nearly a quarter of the regional opportunity.
2Physical opportunity and regulatory difficulty are correlated, not independent. Three candidates stand inside a Source Protection Zone 1, the innermost protection ring around a public water supply. That is not bad luck: an SPZ1 exists because the aquifer beneath is productive and already used for supply. The same fact that makes a site score well is what put the zone there.
3The tier-2 list and the chalk stream map are nearly the same map. Eight candidates sit within 50 metres of a designated chalk stream. The most productive Chalk options are also the most politically exposed freshwater habitat in England.
4Six candidates carry none of the designations we can see, led by Trews Weir at 194.8 Mm3/yr - and three of the six are in Somerset.
5Nowhere is unexamined, but depth is scarce. Every candidate has boreholes nearby; four have none deeper than 50 m within 2 km. Pallingham is the thinnest - four boreholes, none deep - and is the fourth-largest tier-1 system.
7. What Somerset looks like in a regional frame
Somerset returns the largest cluster in the screen - and, more surprisingly, some of the least constrained sites in southern England. Of the six candidates region-wide sitting inside no designation at all, three are Somerset.
| Somerset system | tier | Mm3/yr | rank in tier | constraint | boreholes <2km (deep) |
|---|---|---|---|---|---|
| Crandon Bridge | 1 | 81.3 | 5 of 16 | none of the five | 56 (4) |
| Aller Drove Bridge | 1 | 53.1 | 7 of 16 | SPA at 10 m | 17 (0) |
| Taunton Market | 1 | 39.4 | 8 of 16 | none of the five | 84 (5) |
| Bason Bridge | 1 | 38.5 | 9 of 16 | none of the five | 20 (2) |
| Pen Mill | 2 | 33.9 | 6 of 12 | SPZ at 0.6 km | 101 (18) |
| Chiselborough | 2 | 20.1 | 12 of 12 | INSIDE SPZ 2c | 7 (2) |
Two specific flags for the local work. Chiselborough sits inside a Source Protection Zone (2c) and is part of the nine-gauge inflow set used in the Somerset model, where that constraint is currently not noted anywhere. And Aller Drove Bridge has 17 boreholes within 2 km with none deeper than 50 m - the thinnest evidence of any Somerset candidate. That is an investigation-cost warning, not a geological verdict.
An independent corroboration worth noting. The Somerset configuration records, in a hand-written comment, that Taunton Market duplicates the Bishops Hull reach and should not be summed with it. Tracing the Ordnance Survey river network from scratch, with no knowledge of those comments, reached the same conclusion. That points at a cheap and worthwhile next job: run the same tracer over all nine Somerset inflow gauges to verify independently that none contains another. The local model’s inflow total currently rests on hand-written notes; this would either confirm it or correct it, in about half a day.
8. Next steps
What is missing, and whether open data can supply it
| What is missing | Can open data fix it? |
|---|---|
| Aquifer storage capacity - absent entirely | Partly. Outcrop area is known; specific yield and usable thickness are not published spatially. A bounded estimate with stated assumptions is possible; real numbers need the BGS Aquifer Properties Manual, which no public service supplies. |
| Confinement - only a crude proxy | No. The groundwater body dataset has no confinement attribute at all - checked across all 271 bodies in England. It needs borehole logs read by a person, and we now hold 248,516 scan links to read from. |
| Abstraction licences and existing users | Probably yes. The EA publishes licence data; not yet integrated. This is the biggest missing constraint. |
| Demand - who actually needs the water | Yes. Water company resource plans and Water Resource Zones are open. Water far from demand is not an opportunity. |
| How fast an aquifer will accept water | No. Requires field testing. |
Analyses possible with data already held
- Drought sensitivity: recompute divertible volume on the three driest water years per station, which answers ‘does this survive a dry decade’ without needing climate projections.
- Threshold sweep: test whether the 20 Mm3/yr and 15 km cut-offs do real work or simply sit in a gap in the data.
- Distance to demand: water far from anyone who needs it is not an opportunity. Water Resource Zones are open data, and this is a genuinely new axis that would reorder the table.
- A first-order storage bound for tier 1: outcrop area multiplied by a plausible range of specific yield and usable thickness. Crude, but it would let the screen say whether the resource exceeds plausible storage - which is a stronger claim than it currently makes.
- Borehole log triage: the deep holes on aquifer outcrop near each candidate already have scan links attached. The top twenty could be read by a person.
All code, method and intermediate figures are held in the project repository. Data fetchers are resumable and rate-limited; raw downloads are never modified after collection. Attribution: flow data © Environment Agency, OGL v3. Geology and borehole index © UKRI / BGS. Groundwater bodies, basin districts and Source Protection Zones © Environment Agency, OGL v3. Protected sites © Natural England, OGL v3. Chalk streams © The Rivers Trust. Contains OS data © Crown copyright and database right 2026.
This note was written in Word; the text above is a faithful conversion, and the original is the authoritative copy.
- Download the original (.docx)
- Read the screen it describes: Mapping the opportunity