Mapping the opportunity
A first-pass screen for seasonal aquifer storage in southern England
A first-pass screen for seasonal aquifer storage in southern England
Strategic working note v1 | draft for discussion | August 2026
1. The question
England’s geology is mapped in remarkable detail. Its rivers are gauged, its aquifers designated, its groundwater bodies classified. What does not exist is a map that puts those layers together and asks a single question: where does surplus winter river flow sit beside ground that could hold it until summer?
This note is a first attempt. It screens 370 river gauges across southern England for divertible winter surplus, tests each against the productive aquifers within reach, and records the regulatory state of the groundwater body beneath. It is built entirely from open data - Environment Agency flow records, BGS hydrogeology, Environment Agency groundwater bodies, Ordnance Survey rivers - and every figure in it can be re-derived.
What it is not. It is not a feasibility assessment and not a prediction of what would be licensed. Aquifer productivity maps say nothing about storage volume and nothing about confinement - and high productivity is as much a reason water will leave a store as a reason it will enter one. Nothing here is tested against abstraction pressure, existing licences, ecology, water quality, ground conditions or cost. It identifies where the physical ingredients coincide. That is a starting point for investigation, not a shortlist for construction.
2. Method
Divertible resource. For each gauge, from its own 2015-2025 daily mean flow record: a trigger at Q12.5 (the flow exceeded 12.5% of the time - a high flow) and a hands-off threshold at Q19, below which the river is never drawn. Divertible volume on a qualifying day is (flow - hands-off) x 86,400, annualised over water years so no winter is split across two totals. Each catchment is therefore measured against its own hydrology rather than a national threshold, and the rule is shaped like an abstraction licence condition rather than a wish.
Aquifer tiers. Two, ranked, with the reasoning stated rather than buried in a score:
| tier | rule (BGS 1:625k, within 15 km) | km2 in box | units |
|---|---|---|---|
| 1 intergranular | highly productive, significant intergranular flow (class 1A) | 1,500 | Lower Greensand; Triassic / Sherwood sandstone |
| 2 fractured | highly productive, fracture-dominated - Chalk only (class 2A) | 8,681 | White Chalk; Grey Chalk |
| excluded | meets the tier-2 test, excluded by judgement | 747 | Great Oolite; Inferior Oolite |
Tier 1 ranks above tier 2 because intergranular storage behaves predictably: water occupies pore space and stays where it is put. Tier 2 is retained despite fracture flow because it is proven in practice - the North London ASR scheme stores water in confined Chalk. The Jurassic oolitic limestones meet the tier-2 classification test and are excluded by judgement, on evidence: Environment Agency borehole records show the Inferior Oolite at Mells swinging 2.37 m a year against 6.5-13.4 m in three Chalk boreholes. Thin seasonal storage, not comparable. The exclusion is drawn on the map so it can be argued with.
The rule. A gauge is a candidate if divertible volume exceeds 20 Mm3/yr and a tier 1 or tier 2 aquifer lies within 15 km. 73 of 370 gauges qualify.
3. Two traps, stated before the results
Volumes are nested and must never be summed. Kingston on the Thames measures the same water as Reading, Windsor and Sutton Courtenay upstream of it - and also the Mole and the Wey, which join under their own names, so grouping by river name would miss them. Systems are therefore traced through the Ordnance Survey river network. The 73 candidates collapse to 28 river systems. Adding all 73 gives 5,446 Mm3/yr; the 28 systems total 1,943. Nearly two thirds of the naive figure is the same water counted again downstream. Each row below carries its own measured volume, which already integrates everything above it.
Volume is not opportunity. The Thames at Kingston is the largest divertible resource in the region by a factor of two - and it appears at number 17, because ranking is by tier first. A vast flow beside fractured chalk in the most heavily abstracted reach in England is not the same prospect as a moderate flow sitting on sandstone. Sorting the table by volume alone would say the opposite, and would be wrong.
4. Results
28 river systems pass: 16 on tier 1 intergranular aquifer, 12 on Chalk. Of these, 14 sit in a groundwater body at Good quantitative status, 4 at Poor, and 10 outside any body. By river basin district the resource is more evenly spread than expected - South West 13 systems and 830 Mm3/yr, Thames 6 and 701, South East 8 and 300, Severn 1 and 112.
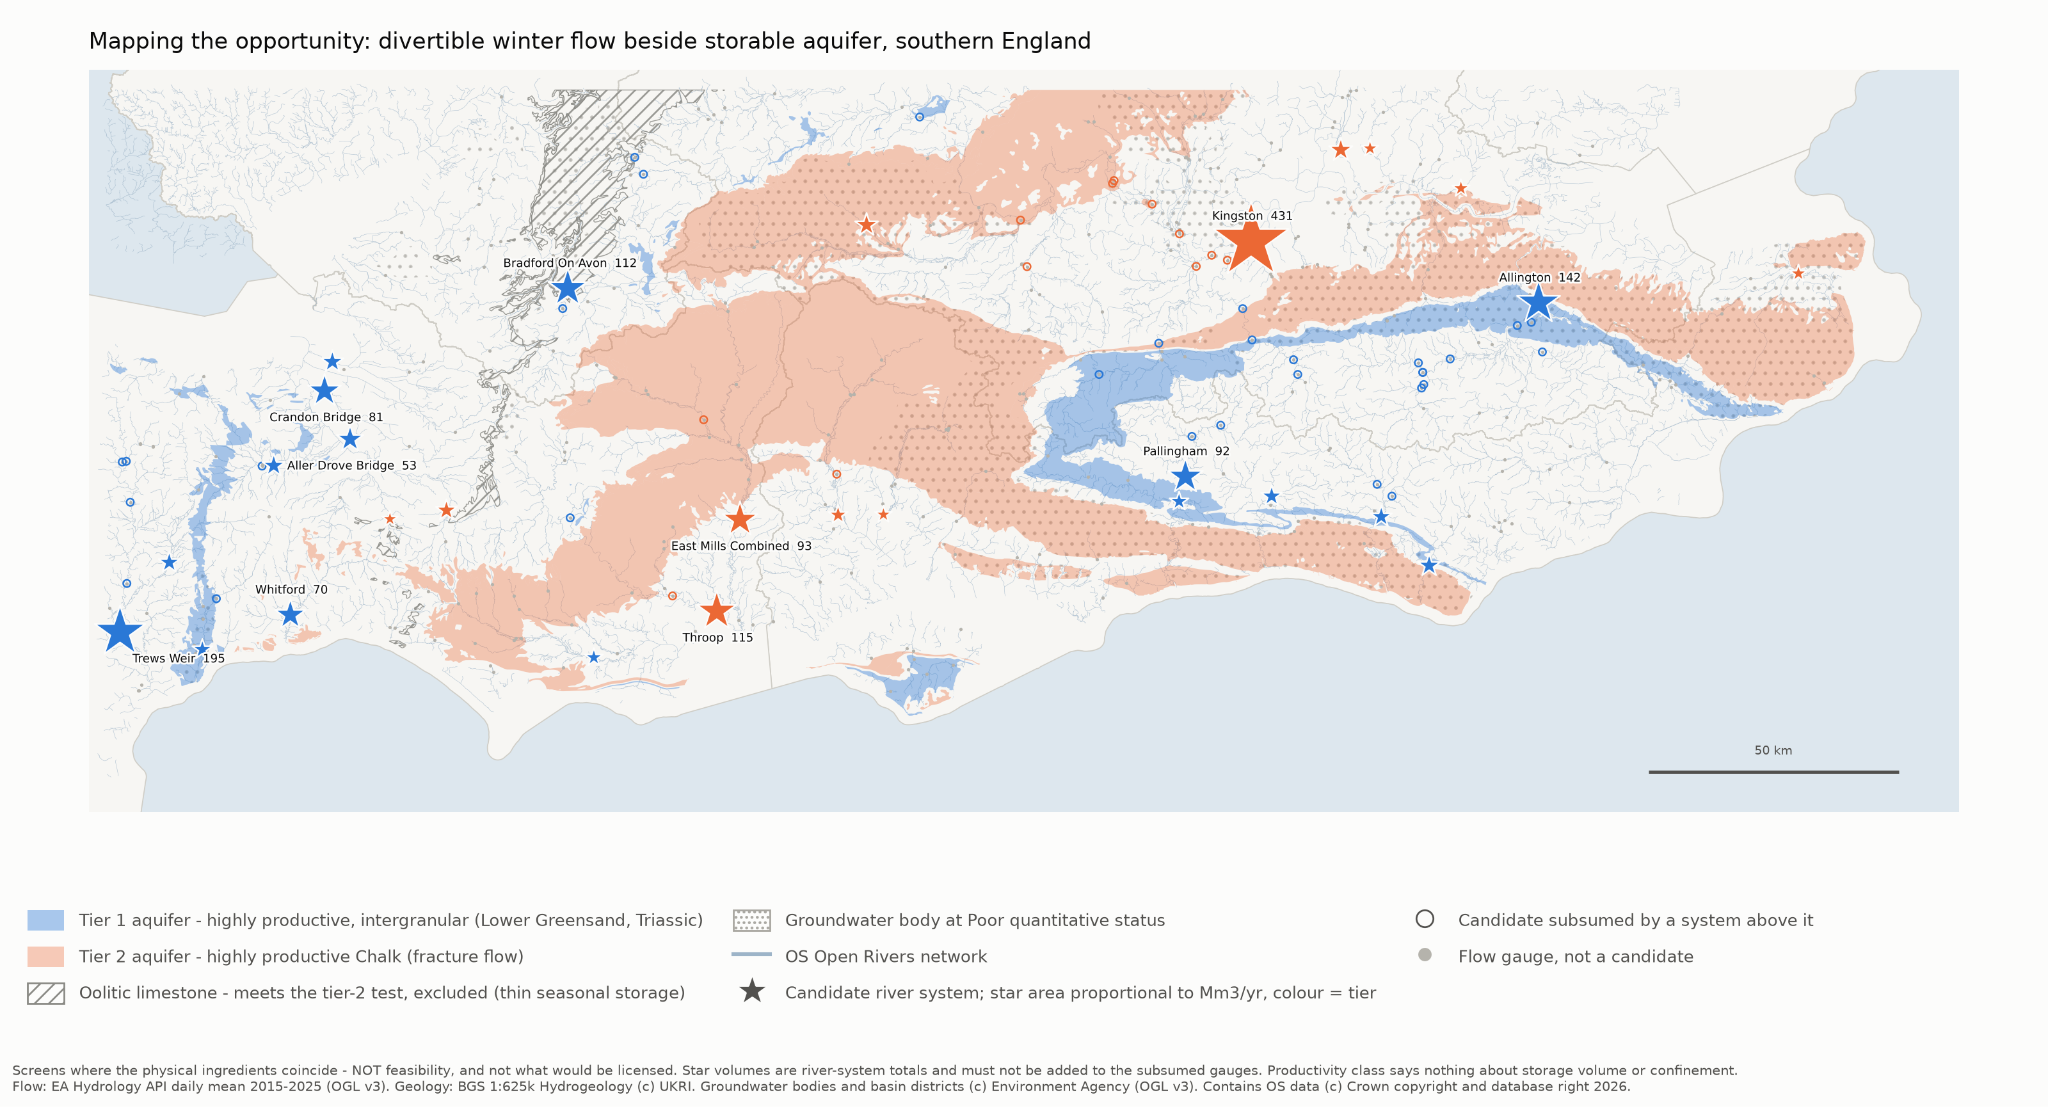
Figure 1. The screen. Star area is proportional to river-system divertible volume; colour is aquifer tier. Hollow circles are candidates subsumed by a system downstream and must never be added to it. Full-size version available separately.
| # | tier | system | river | Mm3/yr | subsumes | aquifer km | WFD quantitative status |
|---|---|---|---|---|---|---|---|
| 1 | 1 | Trews Weir | Exe | 194.8 | 4 | 11.8 | Good |
| 2 | 1 | Allington | Medway | 141.5 | 9 | 0.0 | Poor |
| 3 | 1 | Bradford on Avon | Bristol Avon | 112.2 | 3 | 12.1 | Poor |
| 4 | 1 | Pallingham | Arun | 92.2 | 2 | 2.5 | outside any body |
| 5 | 1 | Crandon Bridge | King’s Sedgemoor Drain | 81.3 | 0 | 4.6 | Good |
| 6 | 1 | Whitford | Axe | 70.2 | 0 | 14.7 | Good |
| 7 | 1 | Aller Drove Bridge | Sowy River | 53.1 | 0 | 5.2 | Good |
| 8 | 1 | Taunton Market | Tone | 39.4 | 1 | 2.0 | Good |
| 9 | 1 | Bason Bridge | Brue | 38.5 | 0 | 9.3 | outside any body |
| 10 | 1 | Sherman Bridge | Cuckmere | 38.0 | 0 | 0.7 | outside any body |
| 11 | 1 | Barcombe | Ouse | 35.1 | 3 | 0.6 | outside any body |
| 12 | 1 | Woodmill | Culm | 34.8 | 0 | 4.8 | Good |
| 13 | 1 | Sakeham | Adur | 33.8 | 0 | 2.4 | outside any body |
| 14 | 1 | Dotton | Otter | 31.2 | 1 | 0.0 | Poor |
| 15 | 1 | Hardham | Rother | 27.7 | 0 | 0.0 | Good |
| 16 | 1 | East Stoke Flume | Dorset Frome | 25.1 | 0 | 6.3 | Good |
| 17 | 2 | Kingston | Thames | 431.5 | 16 | 8.2 | outside any body |
| 18 | 2 | Throop | Dorset Stour | 115.5 | 2 | 12.1 | Good |
| 19 | 2 | East Mills Combined | Hampshire Avon | 92.6 | 3 | 2.7 | Good |
| 20 | 2 | Low Hall | Lee | 41.6 | 0 | 9.4 | outside any body |
| 21 | 2 | Welford | Lambourn | 40.6 | 0 | 0.0 | Poor |
| 22 | 2 | Pen Mill | Somerset Yeo | 33.9 | 0 | 9.3 | Good |
| 23 | 2 | Testwood | Test | 28.0 | 1 | 9.8 | Good |
| 24 | 2 | Stifford | Mar Dyke | 23.7 | 0 | 0.7 | Good |
| 25 | 2 | Plucks Gutter | Kent Stour | 23.1 | 0 | 0.9 | outside any body |
| 26 | 2 | Redbridge | Roding | 22.5 | 0 | 7.9 | outside any body |
| 27 | 2 | Riverside Park | Itchen | 21.7 | 0 | 7.6 | outside any body |
| 28 | 2 | Chiselborough | Parrett | 20.1 | 0 | 7.2 | Good |
Shaded rows are the Somerset Levels cluster (section 5). ‘Aquifer km’ is the distance to the aquifer of the row’s own tier. ‘Subsumes’ counts upstream candidates whose water this row already contains.
5. The finding that was not expected
The Somerset Levels - the landscape that motivated this work because of its flooding, not its geology - return the largest single cluster in the region. Seven systems in the table lie in or immediately around the Levels: King’s Sedgemoor Drain at Crandon Bridge (81.3 Mm3/yr), the Axe at Whitford (70.2), the Sowy at Aller Drove Bridge (53.1), the Tone at Taunton Market (39.4), the Brue at Bason Bridge (38.5), the Somerset Yeo at Pen Mill (33.9) and the Parrett at Chiselborough (20.1). Together they represent 336 Mm3/yr of divertible winter surplus - more than any other locality in the screen, and drawn from a landscape whose water problem is conventionally described as an excess.
Five of the seven are tier 1, on Triassic sandstone with significant intergranular flow, at measured distances of 2.0 to 9.3 km - not the 42 km to the Dorset Chalk that earlier work in this programme had assumed was the nearest credible store. Four sit in the ‘Tone and North Somerset Streams’ groundwater body at Good quantitative status. This is a regional screen that knew nothing about the Somerset project, applying a uniform rule to 370 gauges, and it nominated the Levels independently.
The caution that must travel with it. The Triassic outcrops are small (242 km2 across the whole region), the screen measures distance to outcrop rather than the presence of a usable store, and the BGS summary for these rocks notes they become saline at depth beneath confining Mercia Mudstone - which is simultaneously the confinement that would make storage work and a water-quality limit on where it could. Nothing here establishes that a store exists. It establishes where to look, and that the answer may be much closer to hand than assumed.
6. What this screen cannot see
- Confinement - the decisive property. Whether an aquifer holds a winter’s water or drains it in weeks is set by confinement, not by productivity class. Local measurement in this programme put unconfined Chalk recession at a 41-day half-life. The Water Framework Directive dataset carries no confinement attribute at all: across all 123 groundwater bodies in the study area, the relevant fields are uniformly ‘Not Applicable’. Distance to a mapped covering formation is reported as a proxy, but the 1:625k map shows bedrock at outcrop - where Chalk is confined beneath London Clay the map shows London Clay - so the proxy locates the edge of a confined margin and cannot demonstrate confinement at a point. Confinement must come from borehole logs.
- Storage volume. No open dataset supplies it. The BGS aquifer-properties service was queried directly during this work: it is a site index recording where property data is held, with no transmissivity and no storativity values. Productivity class describes how readily water moves, not how much the rock will hold.
- Licensing and abstraction pressure. The WFD quantitative status column is reported and deliberately not scored, because it cuts both ways: Poor status is where recharge is most wanted and new abstraction hardest to permit; Good status beside a protected chalk stream may be untouchable. Existing licences are not modelled.
- Source protection zones. No SPZ dataset was available; the join is written and the column will populate when one is supplied.
- Cost, terrain and conveyance. No pipeline routing, no pumping head, no capital cost. Two candidates with equal volume and equal distance may differ by an order of magnitude in cost once lift and route are considered.
7. What follows
- Read the map as a shortlist for desk study, not for schemes. The right next step at any candidate is borehole logs: does a usable thickness of aquifer exist, is it confined, and what do its records say about yield?
- Investigate the Somerset Triassic first. It is the largest cluster, the aquifer is intergranular and close, and the local modelling programme already has the flow records, terrain and demand context to test a scheme there quickly.
- Add the missing layers. Source protection zones, abstraction licences and returns, and protected-site boundaries would each move candidates around, and all three are open data.
- Treat the two tiers as different products. Local modelling in this programme suggests intergranular and fractured settings do different jobs: a confined store banks water for summer supply, while a fast-draining one returns it to the river as delayed baseflow. Both are useful; they are not interchangeable, and a candidate should be judged against the product it can actually deliver.
England has mapped its geology in remarkable detail. The next task is to map the strategic opportunity that geology presents - and then to test, at a handful of places, whether the opportunity is real.
Sources and attribution: flow data from the Environment Agency Hydrology API, daily mean 2015-2025 (OGL v3). Geology: BGS 1:625k Hydrogeology © UKRI. Groundwater bodies and river basin districts © Environment Agency, OGL v3. Contains OS data © Crown copyright and database right 2026. Method, full 28-system table with all attributes, and the appendix of subsumed gauges are in the accompanying technical report.
This note was written in Word; the text above is a faithful conversion, and the original is the authoritative copy.
- Download the original (.docx)
- Read the method note behind it: Mapping the opportunity — how it was built