Banking winter water for a dry summer (version 1)
Version 1, 12 August 2026. This is the summary report. Every number in it comes from a background chapter listed in the sources section, and every one of those chapters can be…
This is version 1, circulated 12 August 2026. Version 2 corrects two figures and adds an eighth option: read Banking winter water for a dry summer instead.
A feasibility study for the Somerset Levels and the Vale of Taunton
Version 1, 12 August 2026. This is the summary report. Every number in it comes from a background chapter listed in the sources section, and every one of those chapters can be regenerated from the raw data with one command.
In one page
Somerset has too much water in February and not enough in July. This study asks whether the surplus can be caught and kept — in a reservoir, underground, or both — and returned when it is needed, for farming and for the rivers and moors.
As we write, July 2026 has been the driest July in the seventeen-year record: 4.5 mm of rain against a July average of 57 mm. That is the problem in one number.
The short answers:
- The water exists. About 148 million cubic metres a year could lawfully be taken from the rivers in this area at high flows — many times what any scheme here would use.
- It arrives in about nine bursts a year, each lasting two days. This, not the annual total, is what makes the engineering hard.
- A reservoir alone cannot bridge a drought. It has no memory between years. An aquifer can, but only if the water put into it stays put.
- The most promising options are not the most obvious ones. The best performers in our tests are a basin that fills itself by gravity when the river is high, and using flood-storage moors that already exist.
- We are not recommending a scheme. No option here has been costed, and several rest on assumptions we have flagged rather than resolved.
1. The current situation
1.1 The problem
The Somerset Levels flood in winter and run short in summer. Both happen for the same reason: the ground is flat, the rivers are slow, and the water arrives when nobody wants it.
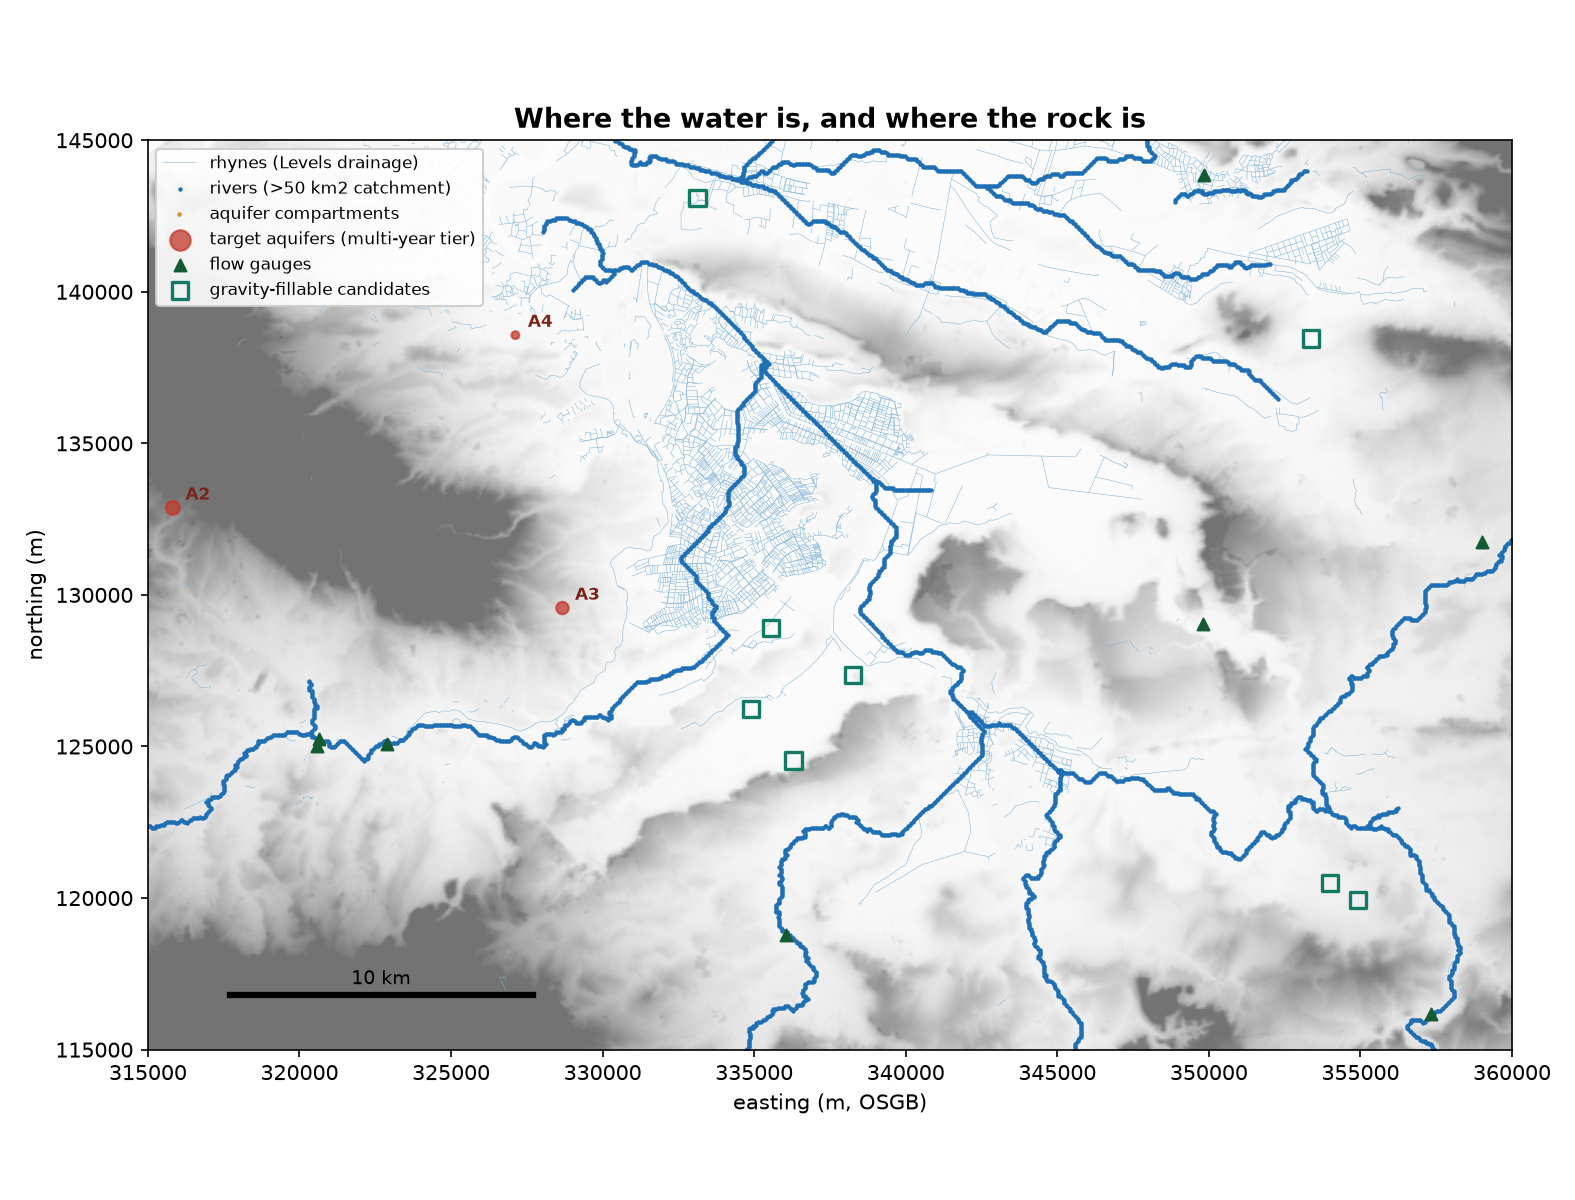
Rivers and the rhyne network of the Levels, the gauges where flow is measured, the aquifer bodies that could store water, and the basins that could catch it. The dense blue mesh is the Levels’ drainage network — around 1,700 km of rhynes below 10 m above sea level.
Two facts govern everything that follows.
86% of the water we could take arrives between November and March. Only 2% arrives in June, July and August, when it is wanted. Any scheme here is therefore a battery, not a tap: its job is to move water across six months, not to find more of it.
In a drought year there is very little to catch. The surplus is a winter thing — nearly all of it arrives between November and March — so a drought year here means a winter whose floods never came. In the worst year of the record only 21% of the average was available to take.
That is why the scheme is a battery rather than a tap. Water given out in a dry summer was caught the previous winter, or the one before that. It cannot be topped up during the drought, because the drought is the failure of the winter that would have filled it.
1.2 What limits a reservoir here
The obvious answer is a reservoir. The constraint is that this is flat, low, soft ground with high land value and deep peat in places. Our working judgement — and it is a judgement, not a calculation — is that much above 5 million cubic metres is not realistic on this ground.
That matters, because to stop losing water over the spillway entirely you would need around 10 million cubic metres. So a reservoir here will always take a share of the winter surplus rather than all of it.
1.3 What limits an aquifer
Water can also be put underground, into porous rock, and pumped back later. This is done elsewhere; the largest UK example supplies London.
Underground storage has one decisive advantage — it does not evaporate and it can hold water between years — and several disadvantages we have had to model carefully:
- It leaks. Water spreads away from where you put it. How fast depends on how big an area you develop: a small well field loses half its water in about a year, a large one in about four.
- It is fullest when you want to fill it. The water table peaks in February, exactly when the surplus arrives.
- Nothing in seventeen years of local records contains an injection. We can bound what the rock would accept from how much it moves naturally. We cannot predict it.
A note on honesty. That last point is the largest single uncertainty in this study. We have not resolved it and we do not claim to. What we have done is make sure no number in this report depends on predicting it — where an injection rate is needed, we use a bound and say so.
1.4 The three tests
Every option in this report faces the same three tests.
| test | what it asks | |
|---|---|---|
| 1 | As built | A scheme switched on in 2010 with empty stores. What would it actually have delivered? The record opens on its own driest year, so this is a hard start — and a fair one. |
| 2 | Mature | The same seventeen years, but with the stores already full at the beginning, as they would be for a scheme that had been running for a decade. The gap between tests 1 and 2 is the cost of being new. |
| 3 | Six droughts in a row | The three driest years on record, stitched back to back and run twice. Every day is a day that really happened; only the order is invented. This is a stress test, not a forecast — we make no claim about how likely it is. |
The measure throughout is millions of cubic metres delivered during a drought summer — water put on fields or into low rivers in April to September of a dry year. We report absolute volumes rather than “% of demand met”, because demand turns out not to be the limiting factor (§2.3).
2. What is modelled, and what it is built from
A reader entitled to be suspicious should be able to see what is measurement, what is modelling, and what is assumption. This section is that.
2.1 The chain
   RAINFALL  ─▶  SOIL  ─▶  RIVER FLOW  ─▶  WHAT MAY BE TAKEN
   (77 gauges)              (12 gauges)     (licence-shaped rule)
                                                   │
                                                   ▼
   AQUIFER  ◀── INJECTION ── RESERVOIR ── DIVERSION
   (rock properties,          (terrain,      (pumps or gravity)
    published)                LiDAR)
       │
       ▼
   RECOVERY ─▶ FARMS and RIVERS
Each stage is a separate, testable chapter. Nothing is a black box.
2.2 Where the data comes from
| what | source | how good |
|---|---|---|
| rainfall | 77 Environment Agency gauges, 2010–2026 | measured |
| river flow | 12 EA gauges, daily, 2010–2026 | measured |
| terrain | 1 m LiDAR, national survey | measured |
| geology | British Geological Survey mapping and borehole logs | mapped, interpreted by us |
| rock properties | BGS regional report WD/97/34 | published, not site-specific |
| land use | Crop Map of England 2024 | classified from satellite; confidence 0.49 |
| abstraction licences | EA register, one 100 km² window | measured, small sample |
| moor water levels | Water Level Management Plans | published, 2009–11 vintage |
2.3 What we found we did not need to model
Demand is not the constraint. Licensed agricultural abstraction across the study area works out at 2.3–3.2 Mm³/yr. The water that could physically do good — enough to remove the soil-moisture deficit on the arable land alone — is about 108 Mm³/yr. The licence is under 1% of what would be useful.
So no option here is limited by whether anyone wants the water. They are all limited by how much can be caught and kept.
2.4 The honest ledger
Real trade-offs — physical, and they will not go away:
| trade-off | why |
|---|---|
| big well field vs small | large fields hold water longer but cost more and may not fit the rock body |
| reservoir vs wells | a reservoir is fast and expensive; the ground is slow and cheap |
| one large site vs several small | several catch more water; each needs its own land, consent and plant |
| catching floods vs holding levels | a basin kept empty catches more but is useless as a landscape feature |
Model assumptions — choices we made, which could be made differently:
| assumption | value | effect if wrong |
|---|---|---|
| reservoir realistically buildable | ≤5 Mm³ | changes the balance between surface and underground storage |
| rock porosity and transmissivity | published regional values | scales every underground number |
| how much leaked water returns to rivers | 80% | tested: changes answers by 1–3%. Not a risk |
| settling time before injection | 2 days | sets a minimum basin size, ~0.3 Mm³ |
| flood depth above channel bed | 2 m | decides which sites can fill by gravity — the most influential guess here |
Known unknowns — things we could not resolve:
- What the rock will actually accept when injected. No local precedent.
- Whether injection wells would clog. This is the usual failure mode of such schemes and we have not modelled it at all.
- Costs. Nothing in this report is costed. Every comparison is “X delivers more water than Y”, never “X is better value than Y”.
3. The options
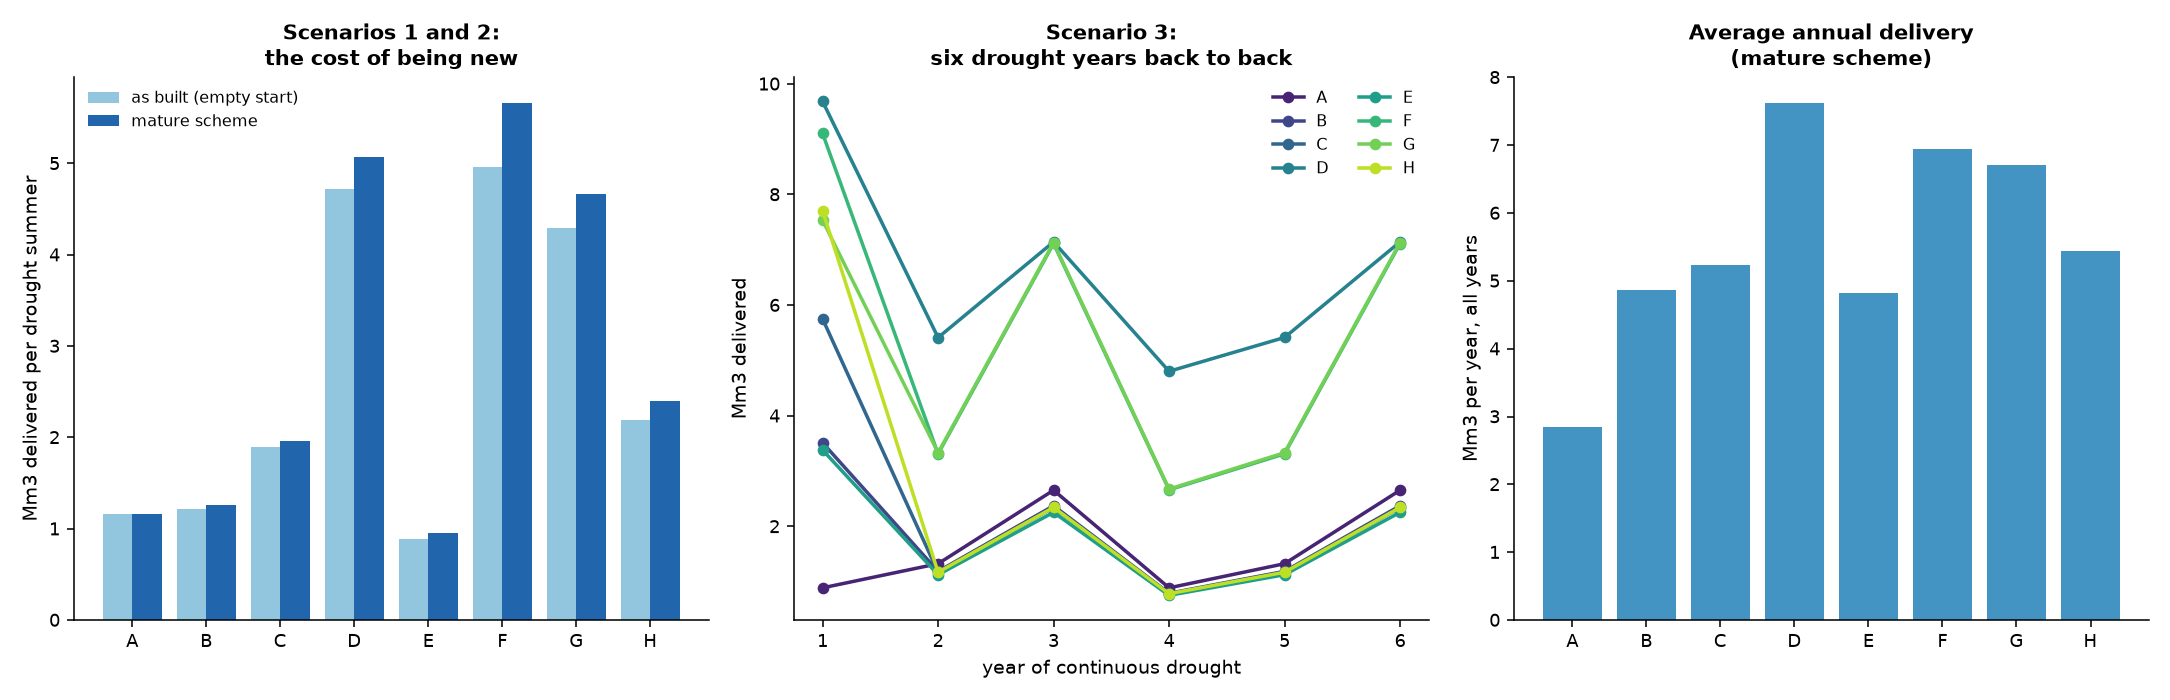
Left: delivery in a drought summer, as built and mature. Middle: the six-year drought — note the zigzag, which is the three-year sequence repeating, not a failure pattern. Right: average annual delivery across all years.
| option | as built | mature | drought yr 1 | drought yrs 2–6 | |
|---|---|---|---|---|---|
| A | Reservoir only, 5 Mm³ | 1.05 | 1.05 | 0.88 | 0.9–2.6 |
| B | Aquifer only, no reservoir | 1.22 | 1.26 | 3.51 | 1.1–2.4 |
| C | Aquifer + reservoir | 1.35 | 1.41 | 3.27 | 1.1–2.4 |
| D | Three sites, three rivers | 4.72 | 5.07 | 9.68 | 4.8–7.1 |
| E | Leaky + tight aquifers, linked | 0.87 | 0.94 | 2.27 | 0.7–2.3 |
| F | Gravity-filled basin | 4.97 | 5.67 | 9.10 | 3.3–7.1 |
| G | Existing flood-storage moor | 4.29 | 4.67 | 7.53 | 2.7–7.1 |
Millions of cubic metres delivered per drought summer. Year 1 is the mature store being spent; years 2–6 are what each option can catch from the drought years themselves. The range reflects which of the three drought years is playing — the sequence repeats after year 3, so the pattern is cyclical rather than a steady decline.
A. Reservoir only
1.05 Mm³, and no benefit whatever from being mature.
This is the telling result. A reservoir delivers the same in year one as in year twenty, because it has no memory between years — it empties every summer and refills every winter. It is a seasonal buffer, not a drought store.
It also does the least of any option in the first year of a long drought (0.88 Mm³) because it starts that drought empty, having spent its water the previous summer.
Its six-year drought trace is worth a second look: 0.88, 1.31, 2.62, 0.88, 1.31, 2.62. Exactly periodic. The scheme’s performance in year four is identical to year one because nothing whatever carried over — which is as clean a demonstration as the model can give that a reservoir is a seasonal buffer and not a drought store.
Real trade-off, not a modelling artefact. If the objective is resilience across years rather than within one, surface storage alone cannot provide it at any size this ground allows.
B. Aquifer only, no reservoir
1.22 → 1.26 Mm³. River water pumped directly into wells, no basin at all.
It works, and it is the cheapest thing to build. Its weakness is that it can only take water while the river is high — with no basin there is nothing to hold a flood in while the wells work through it. It also has no settlement stage, so raw flood water goes straight down the wells, which is the arrangement most likely to clog them.
C. Aquifer + reservoir
1.35 → 1.41 Mm³. The conventional managed-recharge scheme: catch the flood in a basin, inject it over the following weeks.
Better than either part alone, and it does gain from maturity — the underground store carries water between years where the reservoir cannot. This is the baseline everything else should be judged against.
D. Three sites on three rivers
4.72 → 5.07 Mm³ — roughly 3.6× option C.
The largest gain in the study, and the reason is simple: the rivers do not flood at the same time. Three modest intakes on the Tone, the Isle/Parrett and the Brue/Yeo catch about 10% more water than one large intake of the same total capacity, because each is filled by its own river’s ordinary high flows.
There is a real cost. Three sites need three sets of land, consents and plant. And splitting the underground store three ways makes each part leak faster — we measured that penalty at about 5%, and the extra rivers more than pay for it.
A correction we owe the reader. An earlier version of our analysis reported this option as 3.9× better than it is, because of a fault where each site was given three times the intake capacity of the comparison. We found it, fixed it, and the corrected figures are above. The background chapters record what happened.
E. Leaky and tight aquifers, linked
0.87 → 0.94 Mm³ — the worst performer, and instructive.
The idea: use a small, “leaky” rock body that fills quickly and drains over months as a natural way of feeding rivers through the summer, and pass the rest into a larger, tighter body for long-term storage.
The physics is elegant and the arithmetic defeats it. A rock body that releases water on a summer timescale is necessarily small — the same property that sets the timing sets the volume, and you cannot have both. The store that drains at the right speed holds about a third of one year’s demand.
The link between the two stores does work — it improves on the same two bodies unlinked by about a quarter — but it is improving on a poor starting point.
Where it might still earn its place: raising the environmental baseline in normal years at no pumping cost. It simply cannot be the drought mechanism.
F. A basin filled by gravity
4.97 → 5.67 Mm³ — the best performer in our tests.
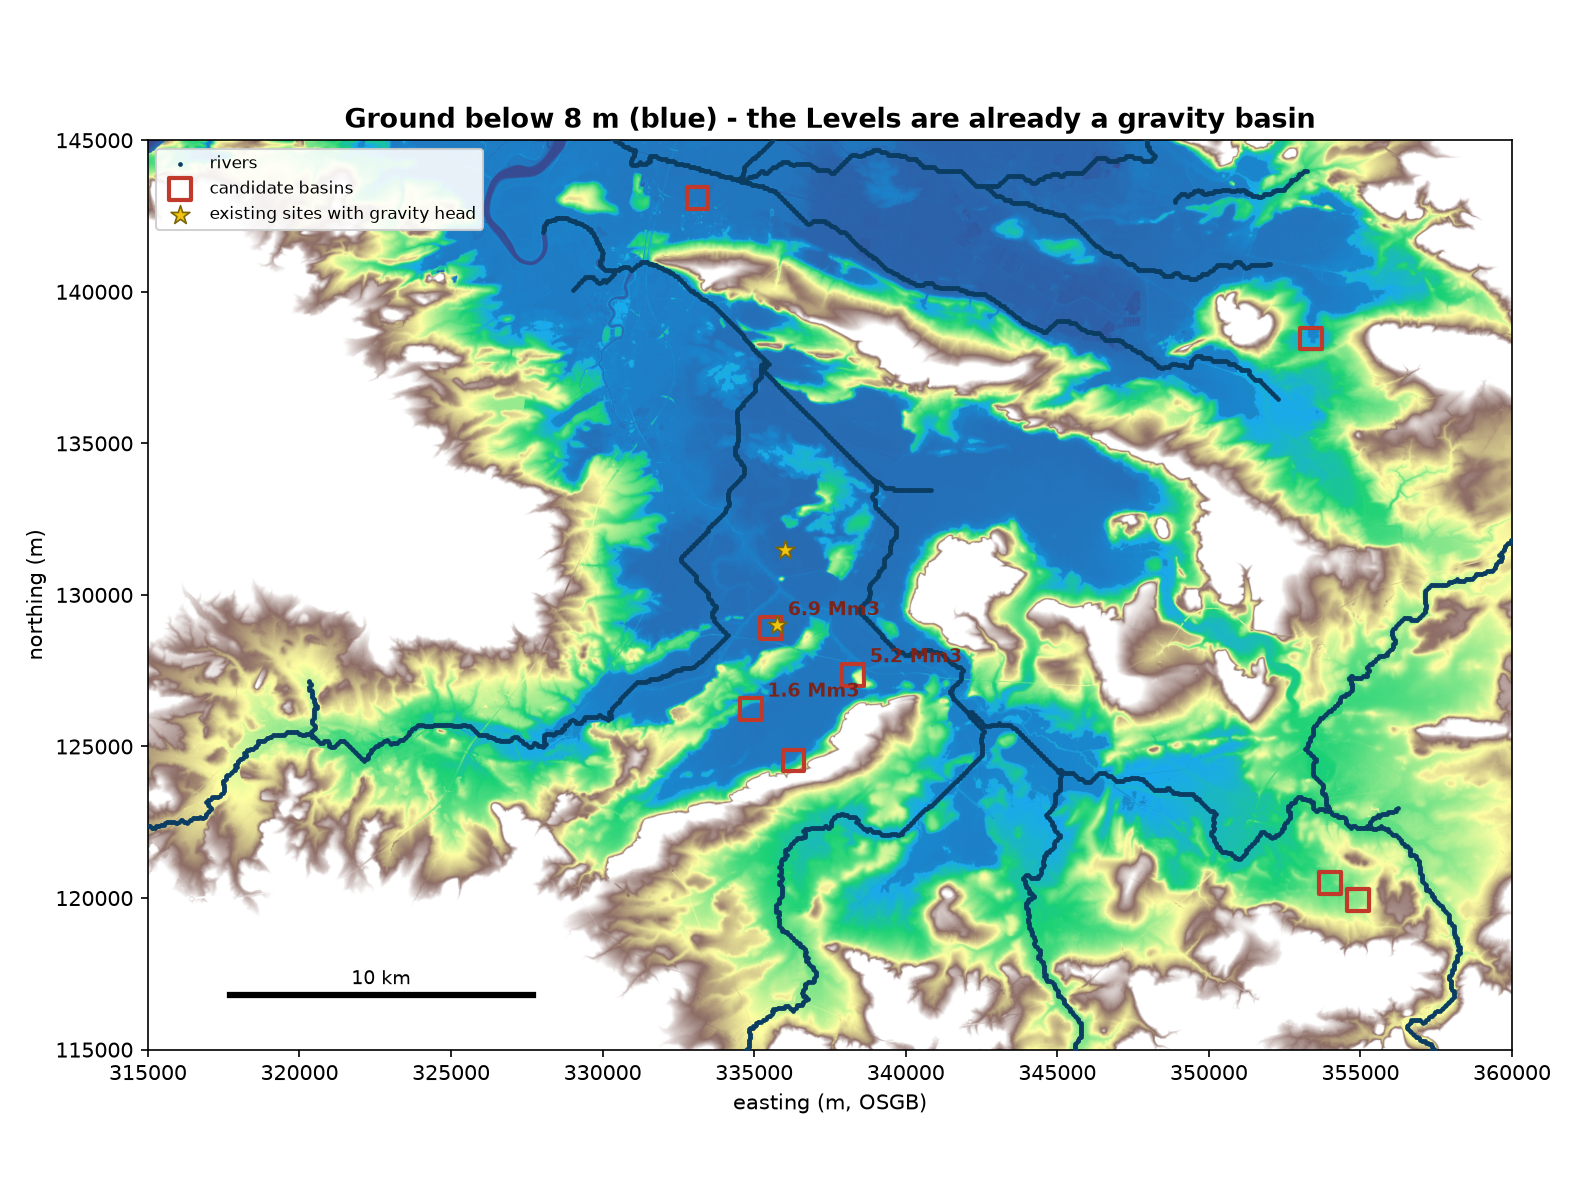
Ground below 8 m above sea level, in blue. Almost the whole of the Levels lies within a couple of metres of its rivers’ levels.
The insight is about timing. The water arrives in nine bursts a year, each about two days long, carrying a typical 1.1 million cubic metres. To catch a whole one you would need to move 560,000 cubic metres a day. A large pump manages about a quarter of that.
The events are too fast to pump. But a basin sitting below the river at flood level fills itself, under the river’s own weight, with no pump and no energy — and empties back to the river afterwards because its bed sits above the river’s normal level.
We screened the terrain for ground that sits in that window and found eight candidate basins, the best holding around 7 Mm³ within 600 m of a channel.
This is the option we would most want to test further, and also the one resting on our shakiest assumption: we have no model of river level, so “flood level” is estimated from the terrain. Change that assumption by a metre and the shortlist changes.
G. Using an existing flood-storage moor
4.29 → 4.67 Mm³, using infrastructure that is already built.
Our terrain screen produced an awkward result: the two largest “candidate basins” were 184 km² and 103 km². Those are not sites — they are the moors themselves.
Which is the point. The Levels already work this way. Curry Moor is an existing flood-storage moor, filled from the River Tone through inlets at Knapp and New Bridge, and emptied by a pumping station. The Internal Drainage Board has operated it for decades.
So the question changes from where do we build a basin to can moors that already flood on purpose also be used to recharge an aquifer? Most of the capital exists. What is missing is the injection plant and an operating agreement.
It inherits every constraint in the moor’s management plan: summer water levels held for stock and wildlife, winter levels for birds, and an outfall that only drains when the tide allows.
4. What the three tests taught us
The cost of being new is real but not fatal. Across the options, maturity is worth between nothing (option A) and about 15% (option F). It matters most in the early years: a scheme commissioned in 2010 would have met little of the 2010–11 drought, simply because it had not yet banked anything.
The mature store buys about one year. Year 1 of the drought test is the store being spent, and it separates the options widely — 0.9 Mm³ for a reservoir alone against 9.7 for three sites. From year 2 onward each option settles into a pattern set by what it can catch from that year’s flows, and the differences within each group nearly vanish: options A, B, C and E all deliver between 0.7 and 2.6 Mm³ regardless of how much storage they hold.
That is the most decision-relevant finding in the study. For multi-year drought, the ability to catch water quickly matters more than the ability to store a lot of it.
Nothing collapses. Even in six consecutive drought years, the driest years still carry enough water at high flow that a scheme keeps delivering something. These schemes do not run dry; they run small.
5. All the options side by side
One chart, one question: on a day in a drought summer, is there enough water to keep a crop alive?
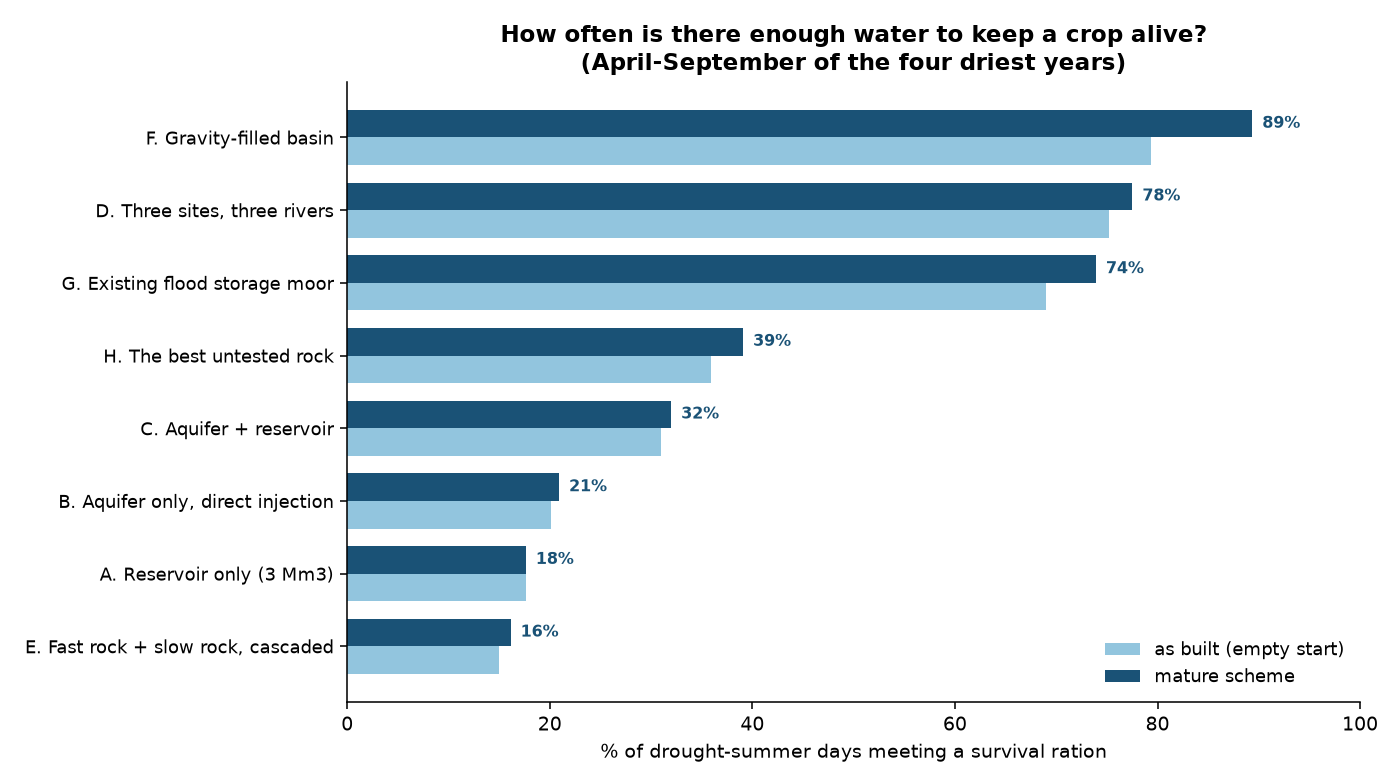
Percentage of April–September days in the four driest years on which the scheme delivers at least a survival ration.
| option | as built | mature |
|---|---|---|
| A. Reservoir only | 16% | 16% |
| E. Leaky + tight aquifers, linked | 15% | 16% |
| B. Aquifer only, no reservoir | 20% | 21% |
| C. Aquifer + reservoir | 22% | 23% |
| G. Existing flood-storage moor | 69% | 74% |
| D. Three sites, three rivers | 75% | 78% |
| F. Gravity-filled basin | 79% | 89% |
A survival ration here means 2,700 m³/day — the rate that spreads half a million cubic metres across a growing season, roughly a sixth of what is licensed. It is a stated stand-in, not an agronomic finding: we have no crop model, and the real figure depends on the crop, the soil and the week. Change the threshold and the percentages move; the ordering is what matters.
The chart splits the options into two groups with almost nothing in between. Three of them cover about a fifth of drought days. Three cover three-quarters or more. The difference between the groups is not how much water they store — it is how much they can catch.
6. What is worth exploring, and why it works
Plain English. No model mechanics.
⭐ Let the river fill the basin itself
What it is: a basin sitting low enough that when the river runs high it simply flows in, through a gate. No pump. When the flood passes, the water drains back out to the river the same way, or is pumped underground at leisure.
Why it works: the water arrives in about nine bursts a year, each lasting two days. To catch a whole burst you would need a pump moving 560,000 cubic metres a day — a very large machine used nine days a year. A gate costs almost nothing to run and has no such limit.
What would stop it: the ground has to be in the right place — below the river when it floods, above it when it does not. We found candidate sites, but our estimate of flood level is the weakest number in this study.
⭐ Use the moors that already flood
What it is: several moors are already flooded deliberately in winter to protect towns, with inlets and pumping stations built and operating. The proposal is to also use that water — put some of it underground before the moor is drained.
Why it works: most of the cost is already spent. The structures exist, the operating practice exists, and the moors already fill and empty on roughly the right rhythm.
What would stop it: those moors are managed to agreed water levels for farming and for birds, and the agreements are not ours to change. It would need the Drainage Board and Natural England, not just an engineer.
⭐ Spread across several rivers
What it is: three modest schemes on three different rivers instead of one large one.
Why it works: the rivers do not flood on the same days. Three modest intakes are busy more often than one large one, so they catch more water in total — about 10% more for the same total pumping.
What would stop it: three sites means three lots of land, consent, access and maintenance. The water case is good; the cost case is untested.
Worth knowing about, but not the answer
A reservoir on its own. Simple and well understood, but it empties every summer and starts each winter from nothing. In our six-year drought test its performance in year four was identical to year one — it carries nothing between years. Good for a dry summer; no use in a dry decade.
Putting water straight down wells with no basin. The cheapest thing to build, and it works, but it can only take water while the river is actually high, and it sends unsettled flood water into the wells, which is how such wells block up.
A fast-draining rock feeding the rivers naturally. An elegant idea: choose rock that releases water over exactly the months you want it. The arithmetic defeats it — rock that releases on a summer timescale is necessarily small, and holds about a third of one year’s demand. It may still be worth having as a cheap way to lift river levels in ordinary years.
7. What we are not saying
- We are not recommending a scheme. Costs would decide between these options and we have not estimated any.
- We are not claiming a return period. The six-year drought is a stress test built from real years in an invented order.
- We are not predicting what the rock will accept. No injection has been made here.
- We have not checked land ownership, designations or consents for any candidate site.
- We have not modelled clogging, the most common way such schemes fail in practice.
- The survival threshold is ours, not an agronomist’s. It sets the percentages in §5, though not the ranking.
8. What we would do next
- Survey river levels at the candidate basins. Cheap, quick, and it decides whether the best-performing option is real.
- Talk to the Drainage Board about the flood-storage moors. If they can double as recharge basins, most of the capital is spent.
- Cost the options. Wells against earthworks is the trade that decides this and it is currently unpriced.
- Do one injection test. It would remove the largest single uncertainty in the study.
Where every number comes from
| section | background chapter |
|---|---|
| the resource, its seasonality and drought collapse | scheme/availability.md |
| aquifer capacity, leakage, carry-over | scheme/aquifer_operation.md |
| reservoir sizing and the spill/evaporation optimum | scheme/sizing.md |
| direct injection, portfolios, realistic basins | scheme/options.md |
| intake sizing and the standard unit | scheme/pump_sizing.md |
| settling and the design rule | scheme/design.md |
| leaky-aquifer release timing | scheme/pairing.md |
| the portfolio correction | scheme/reconcile.md |
| single vs portfolio vs cascade | scheme/synthesis.md |
| event structure and the operating concept | scheme/operating_concept.md |
| gravity head at existing sites | scheme/gravity_sites.md |
| the terrain screen | scheme/gravity_screen.md |
| today’s position and the six-year drought | scheme/drought_tests.md |
| demand, licences and useful water | demand/ |
| rainfall, runoff, river routing, the rhynes | water/ |
| the rock | aquifers/ |
| what reproduces and what does not | MANIFEST.md |
Regenerate everything with python rebuild_all.py somerset.